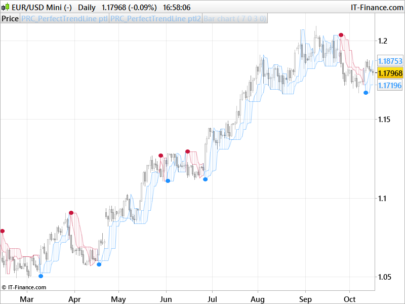
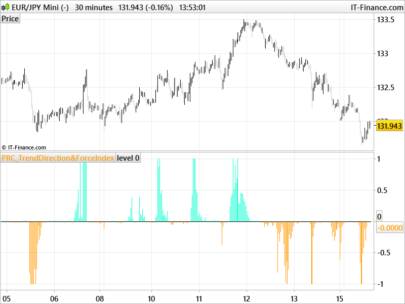
This indicator explains in a continuous way what is happening in the market if there is more demand than supply with which the price of the instrument has an upward trend if, on the contrary, there is more supply than demand, so the price then takes bearish trend or if on the contrary there is no interest in any sense with what the price remains in a lateral range
Summarizing marks the strength of the market and also on both ends both when there is no interest and when the market makes a maximum volume of recruitment marks quite clearly the areas of change of trend.
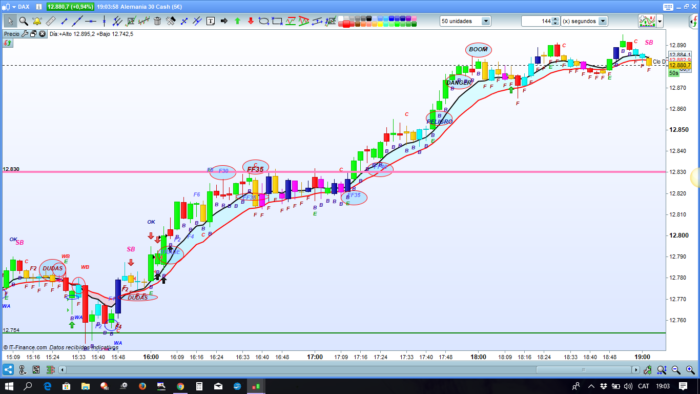
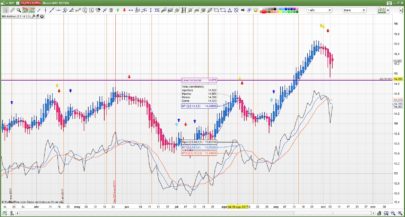
The different zones indicated by this Indicator are the following if, for example, the instrument has reached a high volume of contracting and can not continue with the current trend or impulse as the price changes direction will begin to appear in red or FF35, F30, F8, F6, F4, F2, Doubts, Extrem (Extremaucion) Death on the other hand when it is in any of these low areas and the price starts to pick up again force or impulse (in the previous direction or in the new one address) will begin to appear in blue the following messages Resurr (Resurrection), Blow (Blow of Life), Saluci (Leaving the ICU), Goodbye, Trade, F2, F4, F6, F8, F30, FF35, FF40, Danger, Danger, Boom, Megaboom, max.vol
It is very important to be aware of the areas F30, FF35, FF40, because they are usually the areas of change of direction of the price to make intermediate corrections if the impulse goes from these heights without losing strength and reaches Danger, or Danger in these areas that are sure to have a high volatility must be alert to any pattern or other signal because the change of direction should be imminent in the next 2 or 3 candles maximum to the appearance of the message and if it reaches Boom then the change should be righ now.
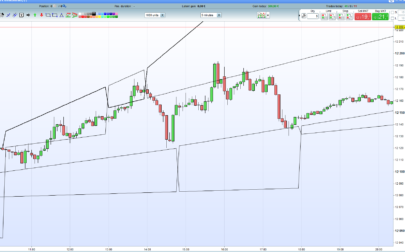
As in almost all oscillators indicators to greater temporality more accuracy of the price response with signals and in very small frametimes sometimes the answer is not so immediate just as a curiosity if someone installs it in their equipment to prove it open the graph from Diario del Dow to see well the whole sequence in the long trend that ended with the last historical maximum there is perfectly the functioning of the indicator.
As a final curiosity we have a couple of candles to delay the manual operation but two messages written in case we are clueless. Entry in green color and closing in red color, however, your information is supportive if you manually operate it is much more high the profitability of the trade I DO NOT BELIEVE IN AUTOMATED SYSTEMS My robots at least do not have Gray Matter On the other hand if we use them as signals if they give very high profitability
This Indicator is only meant to support the operations of our trades, knowing at all times what the direction of the trend is and when to leave. If someone tries to look for signals with the messages E (green) and R (Red), be aware that before you should have done an extensive study with different graphics and different temporalities is not intended to operate using these signals are only intended to be helpful
To understand the meaning of this indicator, which is exactly what it shows and why I recommend watching video https:www.youtube.com/watch?v=crYYnTH5Qz0 and if we join this indicator with the indicator of the colored candles that are in this same library uploaded by me then if we have a very powerful system and when it is known very safe to operate any instrument the sum of both indicators can see it in the video
|
1 2 3 4 5 6 7 8 9 10 11 12 13 14 15 16 17 18 19 20 21 22 23 24 25 26 27 28 29 30 31 32 33 34 35 36 37 38 39 40 41 42 43 44 45 46 47 48 49 50 51 52 53 54 55 56 57 58 59 60 61 62 63 64 65 66 67 68 69 70 71 72 73 74 75 76 77 78 79 80 81 82 83 84 85 86 87 88 89 90 91 92 93 94 95 96 97 98 99 100 101 102 103 104 105 106 107 108 109 110 111 112 113 114 115 116 117 118 119 120 121 122 123 124 125 126 127 128 129 130 131 132 133 134 135 136 137 138 139 140 141 142 143 144 145 146 147 148 149 150 151 152 153 154 155 156 157 158 159 160 161 162 163 164 165 166 167 168 169 170 171 172 173 174 175 176 177 178 179 180 181 182 183 184 185 186 187 188 189 190 191 192 193 194 195 196 197 198 199 200 201 202 203 204 205 206 207 208 209 210 211 212 213 214 |
//Este Indicador explica de una forma continua que es lo que esta ocurriendo en el mercado si hay mas demanda que oferta con lo que el precio del instrumento tiene tendencia alcista si por el contrario hay mas oferta que demanda con lo que el precio entonces coge tendencia bajista o si por el contrario no hay interes en ningun sentido con lo que el precio se queda en un rango lateral //Resumiendo marca la fuerza del mercado y ademas en ambos extremos tanto cuando no hay ningun interes como cuando el mercado hace un maximo en volumen de contratacion marca con bastante claridad las zonas de cambio de tendencia //Las diferentes zonas que va señalando este Indicador son las siguientes si por ejemplo el instrumento ha llegado a un alto volumen de contratacion y no puede seguir con la tendencia o impulso en curso a medida que el precio cambie de direccion empezaran a aparecer en rojo o FF35, F30, F8, F6, F4, F2, Dudas, Extrem (Extremaucion) Death en cambio cuando esta en cualquiera de estas zonas bajas y el precio empieza a coger de nuevo fuerza o impulso (en la direccion anterior o en la nueva direccion) empezaran a aparecer en azul los siguientes mensajes Resurr (Resurreccion), Soplo (Soplo de Vida), Saluci (Saliendo de la UCI), Buencamino , Trade, F2, F4, F6, F8, F30, FF35, FF40, Peligro, Danger, Boom, Megaboom, max.vol //Es muy importante estar atento a las zonas F30, FF35, FF40, porque suelen ser las zonas de cambio de direccion del precio para hacer correcciones intermedias si el impulso pasa de estas cotas sin perder fuerza y llega a Peligro, o Danger en estas zonas que seguro que tendran una alta volatilidad hay que estar atentos a cualquier patron o otra señal porque el cambio de direccion deberia ser inminente en las 2 o 3 velas siguientes maximo a la aparicion del mensaje y si llega a Boom entonces ya el cambio deberia ser inmediato //Como en casi todos los osciladores indicadores a mayor temporalidad mas exactitud de la respuesta del precio con las señales y en frametimes muy pequeños a veces la respuesta no es tan inmediata solo como curiosidad si alguien lo instala en su equipo para probarlo abrir el grafico de Diario del Dow para ver bien toda la secuencia en la larga tendencia que acabo con el ultimo maximo historico alli se ve perfectamente el funcionamiento del indicador ////Como Curiosidad final tenemos aunque con un par de velas de retraso de la operativa manual dos mensajes escritos por si estamos despistados Entrada en color verde y Cierre en color rojo sin embargo su informacion es de apoyo si se opera manualmente es mucho mas alta la rentabilidad del trade NO CREO EN SISTEMAS AUTOMATIZADOS Mis robots al menos no tienen Materia Gris En cambio si los utilizamos como señales si que dan altisimas rentabilidades //Este Indicador esta pensado solo como apoyo a seguir la operativa de nuestros trades sabiendo en todo momento cual es la direccion de la tendencia y cuando salir Si alguien intenta buscar señales con los mensajes E (verde) y R (Rojo) que sea consciente que antes debera haber realizado un amplio estudio con diferentes graficos y diferentes temporalidades No esta pensado para operar utilizando estas señales solo pretenden ser de ayuda ClaridadGrafico=1 Infovelaavela=1 valorEntrCierr = 14 Rge = averagetruerange[14](close) aAdx= ADX[14] once shifttext=ClaridadGrafico sto8=stochastic[8,3] if Infovelaavela= 1 then if aADX > aADX[1] then Drawtext ("B", barindex,Low-0.3*Rge/Shifttext /0.2,SansSerif,boldItalic,10) coloured (055,0,155) elsif aADX < aADX[1] then Drawtext ("F", barindex,Low-0.3*Rge/Shifttext /0.2,SansSerif,boldItalic,10) coloured (155,0,0) endif endif if aAdx crosses over 20 and sto8 < sto8[3] then Drawtext ("TRADE", barindex,high+3*Rge/Shifttext /1,SansSerif,boldItalic,11) coloured (100,100,255) elsif aAdx crosses over 20 and sto8 > sto8[3] then Drawtext ("TRADE", barindex,low-3*Rge/Shifttext /1,SansSerif,boldItalic,11) coloured (100,100,255) endif if aAdx crosses under 20 and sto8 < sto8[3] then Drawtext ("DUDAS", barindex,high+2*Rge/Shifttext /1,SansSerif,boldItalic,11) coloured (150,0,0) elsif aAdx crosses under 20 and sto8 > sto8[3] then Drawtext ("DUDAS", barindex,low-2*Rge/Shifttext /1,SansSerif,boldItalic,11) coloured (150,0,0) endif if aAdx crosses over 55 and sto8 < sto8[3] then Drawtext ("DANGER", barindex,high+2*Rge/Shifttext /1,SansSerif,boldItalic,11) coloured (0,0,0) elsif aAdx crosses over 55 and sto8 > sto8[3] then Drawtext ("DANGER", barindex,low-2*Rge/Shifttext /1,SansSerif,boldItalic,11) coloured (0,0,0) endif if aAdx crosses over 58 and sto8 < sto8[3] then Drawtext ("BOOM", barindex,high+3*Rge/Shifttext /1,SansSerif,boldItalic,11) coloured (0,0,0) elsif aAdx crosses over 58 and sto8 > sto8[3] then Drawtext ("BOOM", barindex,low-3*Rge/Shifttext /1,SansSerif,boldItalic,11) coloured (0,0,0) endif if aAdx crosses over 68 and sto8 < sto8[3] then Drawtext ("MEGABOOM", barindex,high+3*Rge/Shifttext /1,SansSerif,boldItalic,11) coloured (0,0,0) elsif aAdx crosses over 68 and sto8 > sto8[3] then Drawtext ("MEGABOOM", barindex,low-3*Rge/Shifttext /1,SansSerif,boldItalic,11) coloured (0,0,0) endif if aAdx crosses over 78 and sto8 < sto8[3] then Drawtext ("ядерный взрыв", barindex,high+3*Rge/Shifttext /1,SansSerif,boldItalic,14) coloured (0,0,0) elsif aAdx crosses over 78 and sto8 > sto8[3] then Drawtext ("ядерный взрыв", barindex,low-3*Rge/Shifttext /1,SansSerif,boldItalic,14) coloured (0,0,0) endif if aAdx crosses over 22 and sto8 < sto8[3] then Drawtext ("F2", barindex,high+2*Rge/Shifttext /1,SansSerif,boldItalic,11) coloured (100,100,255) elsif aAdx crosses over 22 and sto8 > sto8[3] then Drawtext ("F2", barindex,low-2*Rge/Shifttext /1,SansSerif,boldItalic,11) coloured (100,100,255) endif if aAdx crosses over 24 and sto8 < sto8[3] then Drawtext ("F4", barindex,high+3*Rge/Shifttext /1,SansSerif,boldItalic,11) coloured (100,100,255) elsif aAdx crosses over 24 and sto8 > sto8[3] then Drawtext ("F4", barindex,low-3*Rge/Shifttext /1,SansSerif,boldItalic,11) coloured (100,100,255) endif if aAdx crosses over 26 and sto8 < sto8[3] then Drawtext ("F6", barindex,high+2*Rge/Shifttext /1,SansSerif,boldItalic,11) coloured (100,100,255) elsif aAdx crosses over 26 and sto8 > sto8[3] then Drawtext ("F6", barindex,low-2*Rge/Shifttext /1,SansSerif,boldItalic,11) coloured (100,100,255) endif if aAdx crosses over 28 and sto8 < sto8[3] then Drawtext ("F8", barindex,high+3*Rge/Shifttext /1,SansSerif,boldItalic,11) coloured (100,100,255) elsif aAdx crosses over 28 and sto8 > sto8[3] then Drawtext ("F8", barindex,low-3*Rge/Shifttext /1,SansSerif,boldItalic,11) coloured (100,100,255) endif if aAdx crosses over 30 and sto8 < sto8[3] then Drawtext ("F30", barindex,high+2*Rge/Shifttext /1,SansSerif,boldItalic,11) coloured (100,100,255) elsif aAdx crosses over 30 and sto8 > sto8[3] then Drawtext ("F30", barindex,low-2*Rge/Shifttext /1,SansSerif,boldItalic,11) coloured (100,100,255) endif if aAdx crosses over 35 and sto8 < sto8[3] then Drawtext ("FF35", barindex,high+3*Rge/Shifttext /1,SansSerif,boldItalic,11) coloured (100,100,255) elsif aAdx crosses over 35 and sto8 > sto8[3] then Drawtext ("FF35", barindex,low-3*Rge/Shifttext /1,SansSerif,boldItalic,11) coloured (100,100,255) endif if aAdx crosses over 40 and sto8 < sto8[3] then Drawtext ("FF40", barindex,high+2*Rge/Shifttext /1,SansSerif,boldItalic,11) coloured (100,100,255) elsif aAdx crosses over 40 and sto8 > sto8[3] then Drawtext ("FF40", barindex,low-2*Rge/Shifttext /1,SansSerif,boldItalic,11) coloured (100,100,255) endif if aAdx crosses over 50 and sto8 < sto8[3] then Drawtext ("PELIGRO", barindex,high+3*Rge/Shifttext /1,SansSerif,boldItalic,11) coloured (0,0,150) elsif aAdx crosses over 50 and sto8 > sto8[3] then Drawtext ("PELIGRO", barindex,low-3*Rge/Shifttext /1,SansSerif,boldItalic,11) coloured (0,0,150) endif if aAdx crosses over 17 and sto8 < sto8[3] then Drawtext ("BUENCAM", barindex,high+2.5*Rge/Shifttext /1,SansSerif,boldItalic,11) coloured (0,0,150) elsif aAdx crosses over 17 and sto8 > sto8[3] then Drawtext ("BUENCAM", barindex,low-2.5*Rge/Shifttext /1,SansSerif,boldItalic,11) coloured (0,0,150) endif if aAdx crosses over 15 and sto8 < sto8[3] then Drawtext ("SALUCI", barindex,high+3*Rge/Shifttext /1,SansSerif,boldItalic,11) coloured (0,0,150) elsif aAdx crosses over 15 and sto8 > sto8[3] then Drawtext ("SALUCI", barindex,low-3*Rge/Shifttext /1,SansSerif,boldItalic,11) coloured (0,0,150) endif if aAdx crosses over 13 and sto8 < sto8[3] then Drawtext ("SOPLO", barindex,high+1.5*Rge/Shifttext /1,SansSerif,boldItalic,11) coloured (0,0,150) elsif aAdx crosses over 13 and sto8 > sto8[3] then Drawtext ("SOPLO", barindex,low-1.5*Rge/Shifttext /1,SansSerif,boldItalic,11) coloured (0,0,150) endif if aAdx crosses over 10 and sto8 < sto8[3] then Drawtext ("RESURR", barindex,high+2*Rge/Shifttext /1,SansSerif,boldItalic,11) coloured (0,0,150) elsif aAdx crosses over 10 and sto8 > sto8[3] then Drawtext ("RESURR", barindex,low-2*Rge/Shifttext /1,SansSerif,boldItalic,11) coloured (0,0,150) endif if aAdx crosses under 22 and sto8 < sto8[3] then Drawtext ("F2", barindex,high+2*Rge/Shifttext /1,SansSerif,boldItalic,11) coloured (155,0,0) elsif aAdx crosses under 22 and sto8 > sto8[3] then Drawtext ("F2", barindex,low-2*Rge/Shifttext /1,SansSerif,boldItalic,11) coloured (155,0,0) endif if aAdx crosses under 24 and sto8 < sto8[3] then Drawtext ("F4", barindex,high+2*Rge/Shifttext /1,SansSerif,boldItalic,11) coloured (155,0,0) elsif aAdx crosses under 24 and sto8 > sto8[3] then Drawtext ("F4", barindex,low-2*Rge/Shifttext /1,SansSerif,boldItalic,11) coloured (155,0,0) endif if aAdx crosses under 26 and sto8 < sto8[3] then Drawtext ("F6", barindex,high+2*Rge/Shifttext /1,SansSerif,boldItalic,11) coloured (155,0,0) elsif aAdx crosses under 26 and sto8 > sto8[3] then Drawtext ("F6", barindex,low-2*Rge/Shifttext /1,SansSerif,boldItalic,11) coloured (155,0,0) endif if aAdx crosses under 28 and sto8 < sto8[3] then Drawtext ("F8", barindex,high+2*Rge/Shifttext /1,SansSerif,boldItalic,11) coloured (155,0,0) elsif aAdx crosses under 28 and sto8 > sto8[3] then Drawtext ("F8", barindex,low-2*Rge/Shifttext /1,SansSerif,boldItalic,11) coloured (155,0,0) endif if aAdx crosses under 30 and sto8 < sto8[3] then Drawtext ("F30", barindex,high+2*Rge/Shifttext /1,SansSerif,boldItalic,11) coloured (155,0,0) elsif aAdx crosses under 30 and sto8 > sto8[3] then Drawtext ("F30", barindex,low-2*Rge/Shifttext /1,SansSerif,boldItalic,11) coloured (155,0,0) endif if aAdx crosses under 35 and sto8 < sto8[3] then Drawtext ("FF35", barindex,high+2*Rge/Shifttext /1,SansSerif,boldItalic,14) coloured (155,0,0) elsif aAdx crosses under 35 and sto8 > sto8[3] then Drawtext ("FF35", barindex,low-2*Rge/Shifttext /1,SansSerif,boldItalic,14) coloured (155,0,0) endif if aAdx crosses under 15 and sto8 < sto8[3] then Drawtext ("EXTREM", barindex,high+2*Rge/Shifttext /1,SansSerif,boldItalic,11) coloured (155,0,0) elsif aAdx crosses under 15 and sto8 > sto8[3] then Drawtext ("EXTREM", barindex,low-2*Rge/Shifttext /1,SansSerif,boldItalic,11) coloured (155,0,0) endif if aAdx crosses under 10 and sto8 < sto8[3] then Drawtext ("DEATH", barindex,high+2*Rge/Shifttext /1,SansSerif,boldItalic,11) coloured (155,0,0) elsif aAdx crosses under 10 and sto8 > sto8[3] then Drawtext ("DEATH", barindex,low-2*Rge/Shifttext /1,SansSerif,boldItalic,11) coloured (155,0,0) endif REM Determinamos +DM y -DM p= valorEntrCierr masDM = max(high-high[1], 0) menosDM = max(low[1]-low, 0) if masDM > menosDM then menosDM = 0 endif if masDM < menosDM then masDM = 0 endif if masDM = menosDM then masDM = 0 menosDM = 0 endif REM Calculamos los indicadores direccionales masDI = wilderAverage[p](masDM) menosDI = wilderAverage[p](menosDM) REM Calculamos el ADX DX = ABS(masDI - menosDI) / (masDI + menosDI) * 100 miADX = wilderAverage[p](DX) miadx=miadx //willy=Williams[40](close) sto76=stochastic[76,3] if miadx>15 and sto76 > sto76[1] then if miADX > miadx[1] and miADX[1]<miADX[2] then Drawtext ("E", barindex,low-3*rge/shifttext /1,SansSerif,boldItalic,10) coloured (0,155,0) elsif miADX < miadx[1] and miADX[1] > miADX[2] then Drawtext ("C", barindex,low-3*Rge/Shifttext /1,SansSerif,boldItalic,10) coloured (255,0,0) endif endif if miadx>15 and sto76 < sto76[1] then if miADX > miadx[1] and miADX[1]<miADX[2] then Drawtext ("E", barindex,high+3*Rge/shifttext /1,SansSerif,boldItalic,10) coloured (0,155,0) elsif miADX < miadx[1] and miADX[1] > miADX[2] then Drawtext ("C", barindex,high+3*Rge/shifttext /1,SansSerif,boldItalic,10) coloured (255,0,0) endif endif return |
Share this
No information on this site is investment advice or a solicitation to buy or sell any financial instrument. Past performance is not indicative of future results. Trading may expose you to risk of loss greater than your deposits and is only suitable for experienced investors who have sufficient financial means to bear such risk.
ProRealTime ITF files and other attachments :
Find other exclusive trading pro-tools on ![]()
PRC is also on YouTube, subscribe to our channel for exclusive content and tutorials


Hola Domenec, un indicador muy original y util que ciertamente añade mucha informacion a la evolución de las cotizaciones. Pero tengo una duda: Cual es el motivo de calcular el ADX paso a paso (valor miadx en lineas 161 hasta 186 ) cuando lo puedes hacer en un solo paso sencillo con miadx = ADX[14] ?
Hola Pableitor porque aqui lo que pretendo es programar un nuevo codigao mas ajustado para que de señales de entrada cierre para ayudar a comprender mejor el funcionamiento del mercado si lo pruebas veras que es muy logico que en f30 ff35 ff40 haga los movimientos correctivos intermedios y posteriormente siga el impulso sobre todo en los movimientos importantes entonces la idea es que la señal de entrada y cierre que con el adx normal lleva un par de velas de retraso al estar el codigo abierto del adz se puedan cambiar con alguan constante o cambiando las medias para conseguir una señal mas precisa pero esto lleva su tiempo pero esta es la idea por lo que incluye la programacion del adx en codigo abierto en estas lineas que me comentas
Hola Domenec.
He visto en los videos que hablas continuamente de mercado de futuros con gráficos de minutos. ¿podria aplicar tu indicador a acciones en temporalidad diaria y 4 horas?
Gracias por tus aportes
Claro Juanjo de todas maneras en deinversoratrader.com tienes estsos osciladores evolucionados y si son para cualquier tempo suerte
Hola Domenec, en la descripción hablas del indicador velas de colores, no lo encuentro en la biblioteca, donde lo podría descargar? Gracias
Hola Dron mira en el blog deinversoratrader.com en formacion indicadores ahi hay varios gratuitos y la explicacion detallada de como van