







MACD Divergences on price and indicator
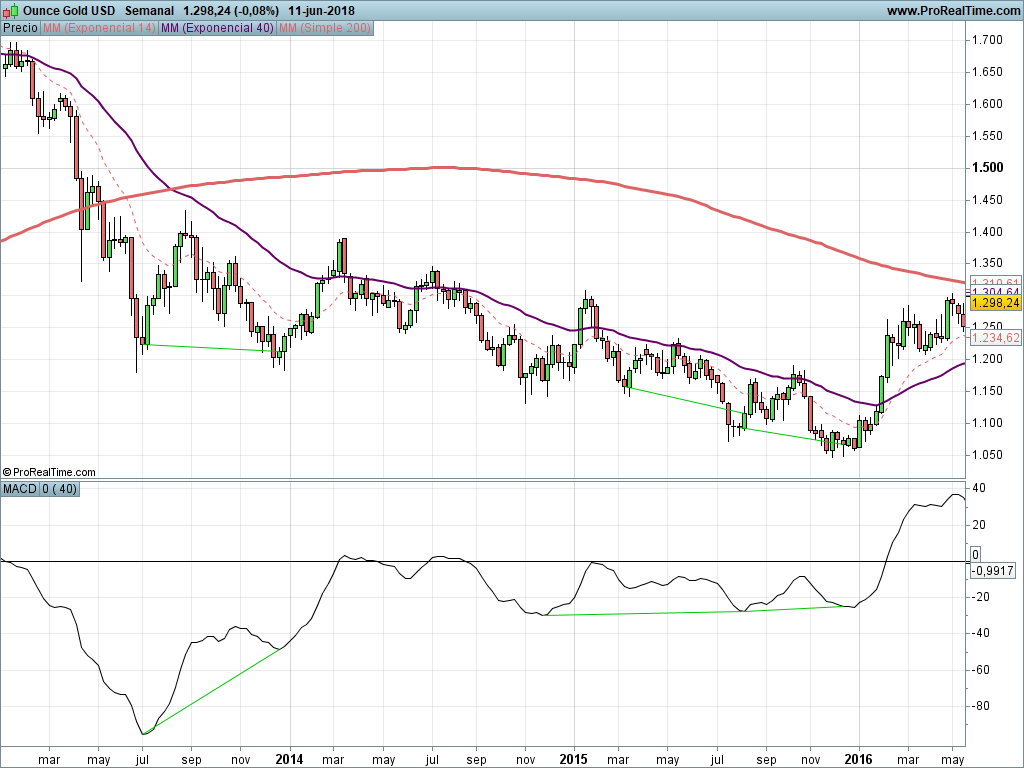
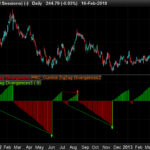
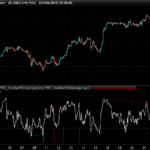
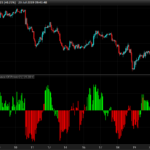
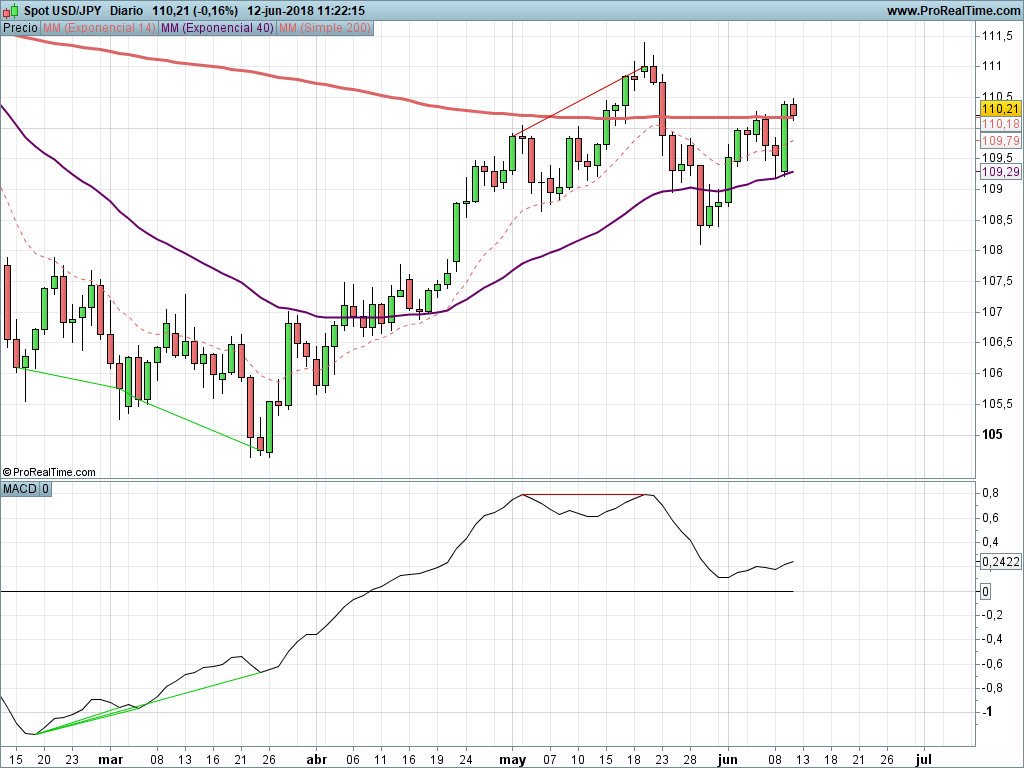
Here you are an indicator that shows divergences on price and MACD at the same time.
Indeed, you need to put 1 indicator on the price chart and another as a new indicator.
Divergences are drawn automatically and it does not repaint.
///////////////////////////////////////////////////////////

// MACD divergences on price
//by Jose Callao
// twitter @jose7674
// attach this indicator to the chart

N=40///N is the number of bars to look back for a divergence. Normal values are 20-40. Must be the same in both indicators

//using any other indicator is as easy as changing the values
miMACD = exponentialAverage[12](close) - exponentialAverage[26](close)

IF (BarIndex > 10+1+N) THEN

 //we look for bearish divergences
 IF (miMACD[1]>miMACD AND miMACD[1]>miMACD[2]) THEN
  extremum2=miMACD[1]
  extremum1=highest[N](miMACD)

  preciomax2=close[1]
  preciomax=Highest[N](close)
  IF(extremum2<extremum1 AND preciomax2>preciomax[1]) THEN
   for i=1 to N
    if close[i]=preciomax[1] then
     zz=i

     drawsegment (barindex[1], close[1], barindex[zz], close[zz]) coloured(200,0,0)
    endif
   next

  endif
 endif

 //we look for bullish divergences
 IF (miMACD[1]<miMACD AND miMACD[1]<miMACD[2]) THEN
  extremum22=miMACD[1]
  extremum11=lowest[N](miMACD)

  preciomin2=close[1]
  preciomin=lowest[N](close)

  IF(extremum22>extremum11 AND preciomin2<preciomin[1]) THEN
   for i2=1 to N
    if close[i2]=preciomin[1] then
     zz2=i2

     drawsegment(barindex[1], close[1], barindex[zz2], close[zz2]) coloured(0,200,0)
    endif
   next
  endif
 endif
endif
return

//////////////////////////////////////////////
/////////////////////////////////////////////

// MACD divergences on MACD
// by Jose Callao
// twitter @jose7674
// Use this indicator in a new window

N=40///N is the number of bars to look back for a divergence. Normal values are 20-40. Must be the same in both indicators

miMACD = exponentialAverage[12](close) - exponentialAverage[26](close)

IF (BarIndex > 10+1+N) THEN

 ///divergencia bajista
 IF (miMACD[1]>miMACD AND miMACD[1]>miMACD[2]) THEN
  extremum2=miMACD[1]
  extremum1=highest[N](miMACD)

  preciomax2=close[1]
  preciomax=Highest[N](close)

  IF(extremum2<extremum1 AND preciomax2>preciomax[1]) THEN
   for i=1 to N
    if mimacd[i]=extremum1 then
     zz=i

     drawsegment (barindex[1], mimacd[1], barindex[zz], mimacd[zz]) coloured(200,0,0)
    endif
   next

  endif
 endif

 ///divergencia alcista
 IF (miMACD[1]<miMACD AND miMACD[1]<miMACD[2]) THEN
  extremum22=miMACD[1]
  extremum11=lowest[N](miMACD)

  preciomin2=close[1]
  preciomin=lowest[N](close)

  IF(extremum22>extremum11 AND preciomin2<preciomin[1]) THEN
   for i2=1 to N
    if mimacd[i2]=extremum11[1] then
     zz2=i2

     drawsegment(barindex[1], mimacd[1], barindex[zz2], mimacd[zz2]) coloured(0,200,0)
    endif
   next
  ENDIF

 ENDIF
endif

return mimacd as "MACD", 0 as "0"
Comments
You must be logged in to post a comment.



Gracias por el indicador y me uno a los que han preguntado si hay algun screener.



Hi friends, any help with a screener for this indicator? Best regards.


I use the break to get off after the first divergency line is drawn. But this seems not work.
How can I just draw the latest divergency line? I try the following but no line is drawn. for i2=1 to N if mimacd[i2]=extremum11[1] then zz2=i2 drawsegment(barindex[1], mimacd[1], barindex[zz2], mimacd[zz2]) coloured(0,200,0) endif break next
Hay alguna manera de hacer un proscreener para este indicador? Lo he intentado pero no lo consigo. Saludos y gracias.

Hola Jose7674, Utilizas algun screener para encontrar candidatos que esten mostrando estas MACD divergences mostradas en tu codigo? Saludos
Hola tradingthelife, has tenido suerte encontrando un screener para este indicador? He estado un tiempo largo buscandolo y no logro conseguirlo tampoco. Saludos

@jose7674 este indicador es una auténtica joya, muchas gracias por compartirlo. Uno de los inconvenientes es la visibilidad, como comentaba @supertiti. Lo he tuneado un poco y después del drawsegment he añadido DRAWARROWDOWN(barindex[1], miRSI[1]) COLOURED(200,0,0) para las bajistas, y DRAWARROWUP(barindex[1], miRSI[1]) COLOURED(0,200,0) para las alcistas. Lo de las divergencias ocultas sería un plus. No tengo nivel para esto, pero @Francesco hizo también un gran trabajo con este indicador que sí las incluye: https://www.prorealcode.com/prorealtime-indicators/rsi-classical-hidden-divergences-indicator/ Saludos y gracias de nuevo por tu aporte.






hello to all, i recently discovered this indicator. would it be possible to add the detection of hidden divergences on it? that would be awesome!