

TTM trend on price
October 23, 2017, 9:09 AM
Indicators
2 Comments
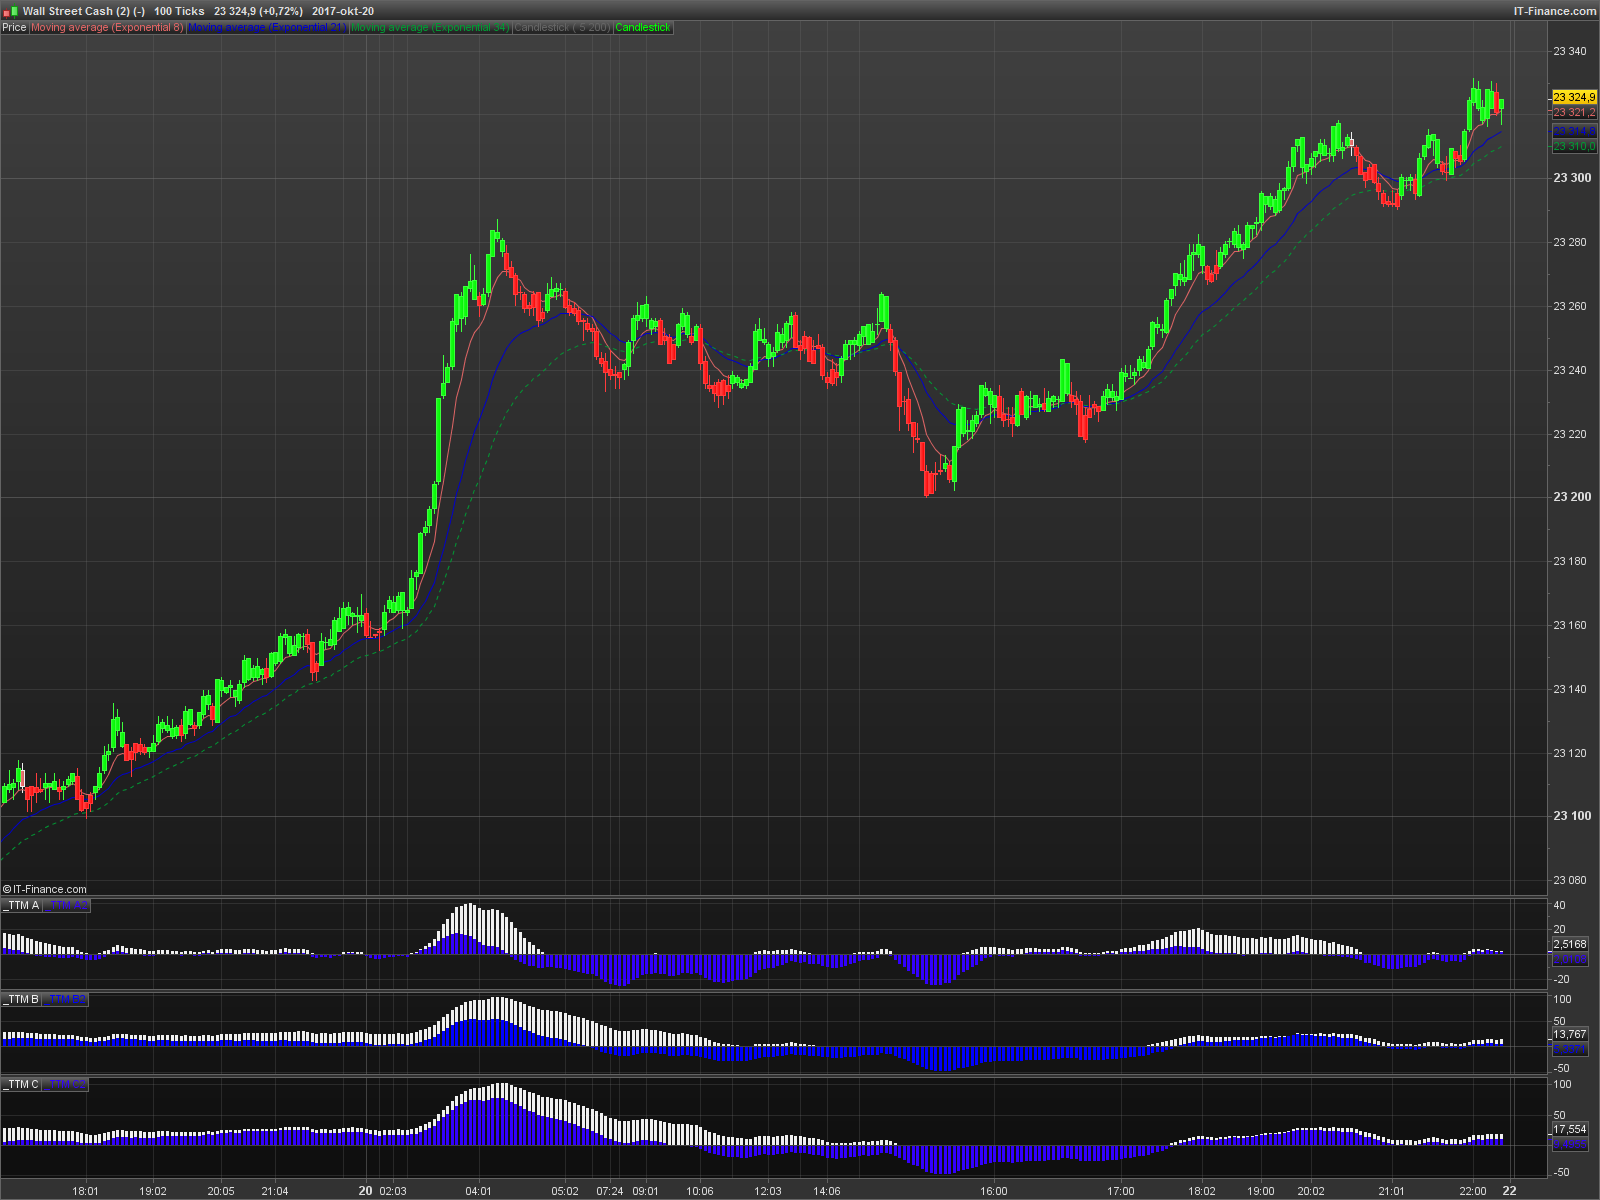
This indicator is from John Carters book “Mastering the trade” an plots the bars green or red.
It checks if the price is above or under the average price of the previous 5 bars.
The indicator should hep you stay in a trade until the colors chance.
Two bars of the opposite color is the signal to get in or out.
averageprice = (((high[5]+low[5])/2)+((high[4]+low[4])/2)+((high[3]+low[3])/2)+((high[2]+low[2])/2)+((high[1]+low[1])/2)+((high[6]+low[6])/2))/6

if close > averageprice then
 drawcandle(open,high,low,close) coloured(0,255,0)
endif

if close < averageprice then
 drawcandle(open,high,low,close) coloured(255,0,0)
endif

return
Download
Filename:
TTM-trend-on-price.itf
Downloads:
276
Average
This author is like an anonymous function, present but not directly identifiable. More details on this code architect as soon as they exit 'incognito' mode.
Author’s Profile
Loading...