

Waddah Attar ADXxBollinger
October 9, 2017, 3:12 PM
Indicators
2 Comments
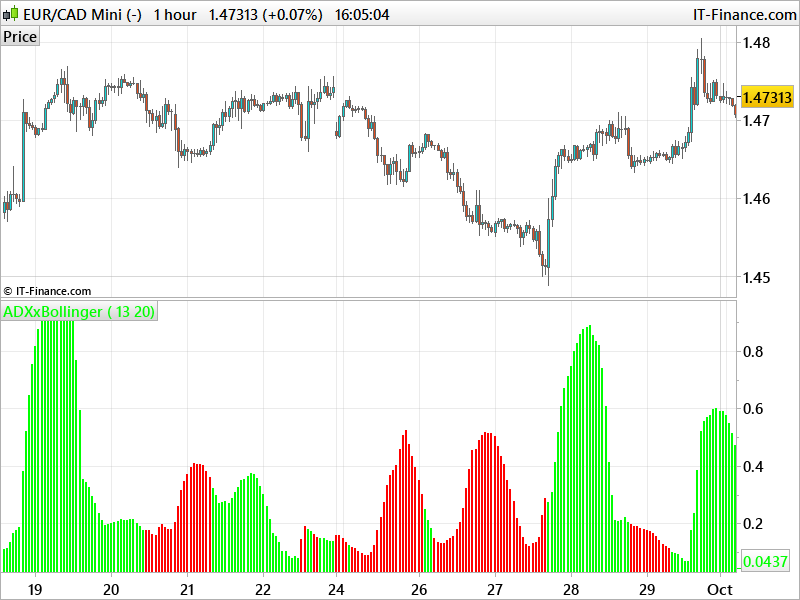
This indicator give ADX trend signals associated with Volatility expansion at the same time.
If the histogram is red, DIminus is above DIplus and if its green, DIminus is under DIplus and the trend is bullish.
The oscillation are made by multiplying the ADX value to Bollinger Bands bandwidth, so you can have a rough idea of the trend force (volatility).
I stumble upon this MT4 indicator while browsing information on the web to help someone making an ADX screener, so here it is converted for prorealtime.
//PRC_Waddah Attar ADXxBollinger | indicator
//09.10.2017
//Nicolas @ www.prorealcode.com
//Sharing ProRealTime knowledge

// --- settings
//ADXPeriod = 13
//BandsPeriod=20
// --- end of settings

adx0 = adx[ADXPeriod]
adx1 = diplus[ADXPeriod](weightedclose)
adx2 = diminus[ADXPeriod](weightedclose)
explo = BollingerUp[BandsPeriod](close)-BollingerDown[BandsPeriod](close)

if adx1>=adx2 then
 r=0
 g=255
else
 r=255
 g=0
endif

return adx0*explo coloured(r,g,0) style(histogram) as "ADXxBollinger"
Download
Filename:
PRC_Waddah-Attar-ADXxBollinger.itf
Downloads:
327
Legend
I created ProRealCode because I believe in the power of shared knowledge. I spend my time coding new tools and helping members solve complex problems.
If you are stuck on a code or need a fresh perspective on a strategy, I am always willing to help. Welcome to the community!
Author’s Profile
Loading...