

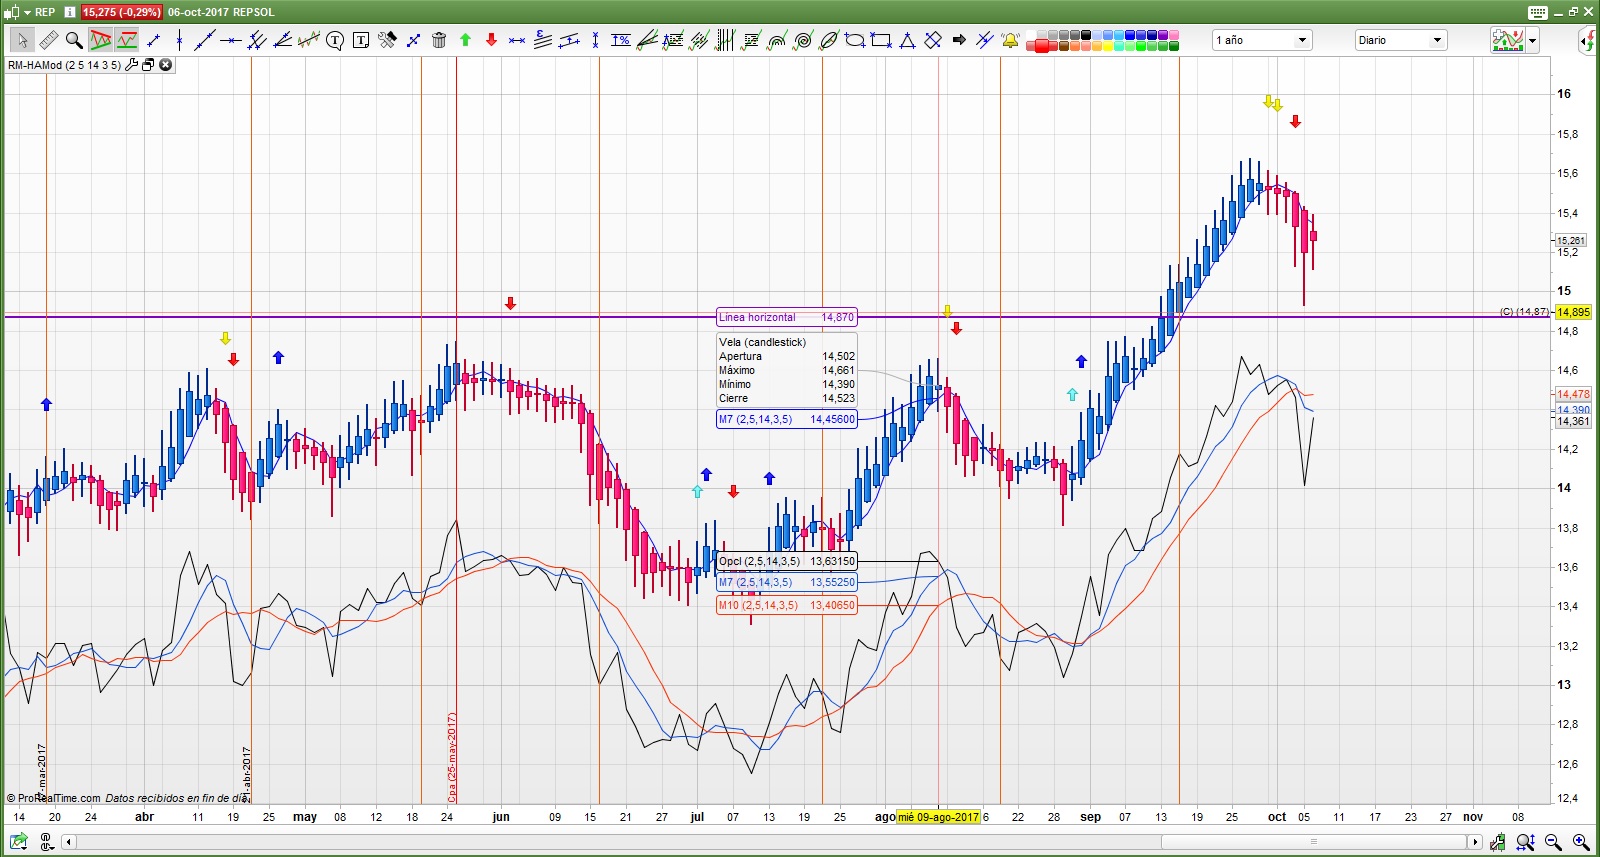
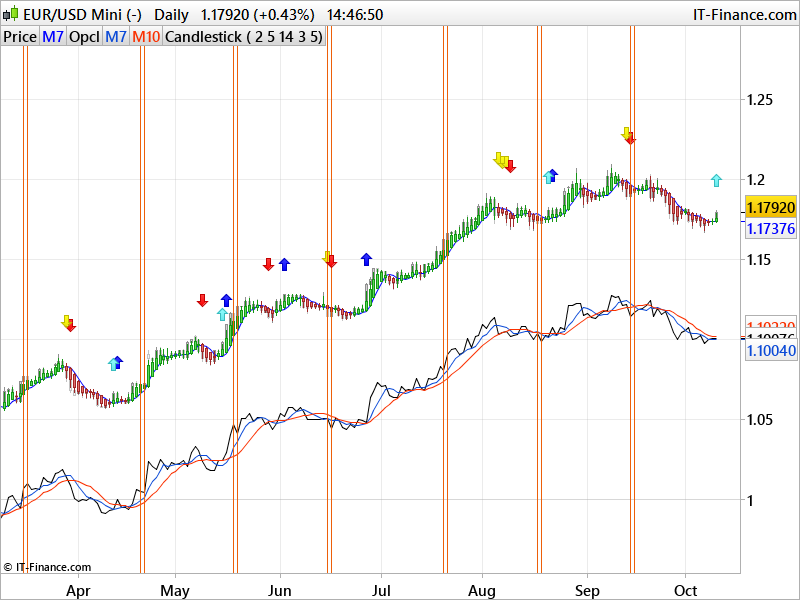
Smoothed Heikin Ashi and SAR trading system signals
October 10, 2017, 1:53 PM
Indicators
16 Comments
Heikin-ashi smoothed modified (from previous version) to reduce false signals. It includes SAR value to reduce false signals.
Rules in Heikin-Ashi:
1- White body sequence = upward trend.
Sequence of black bodies = downtrend.
2- Strong bullish trend = Large white bodies and no lower shadows.
Strong bearish trend = Large black bodies without upper shadows.
3- When the tendency weakens small bodies appear with possible upper and / or lower shadows.
4- A consolidation occurs when small bodies appear with both shadows both above and below.
5- The reversal of a trend can be suspected with the appearance of small bodies with both upper and lower long shadows, or a sudden change of color
//Reglas en Heikin-Ashi:
//1- Secuencia de cuerpos verdes = tendencia alcista.
// Secuencia de cuerpos rojos = tendencia bajista.
//2- Tendencia alcista fuerte = Grandes cuerpos verdes y sin sombras inferiores.
// Tendencia bajista fuerte = Grandes cuerpos rojos sin sombras superiores.
//3- Cuando la tendencia se debilita surgen cuerpos pequeños con posibles sombras superior y/o inferior.
//4- Una consolidación se da cuando aparecen cuerpos pequeños con ambas sombras tanto arriba como abajo.
//5- La reversión de una tendencia se puede sospechar con la aparición de pequeños cuerpos con sombras largas tanto superiores como inferiores, o un cambio repentino de color.
// parámetros
//ONCE SmoothPeriod=2 valor por defecto
//ONCE period=5 valor por defecto
//ONCE Kperiod=5 valor por defecto
//ONCE Kspeed=2 valor por defecto
//ONCE Dperiod=5 valor por defecto
ONCE flecha=0
ONCE Dflech=barindex
ONCE xClose = (open+high+low+close)/4
ONCE xOpen = open
ONCE xHigh = high
ONCE xLow = low
// ciclo normal
IF BarIndex>0 THEN
 xOpen = (xOpen[1]+xClose[1])/2
 xClose = (open+high+low+close)/4
 xHigh = Max(max(high, xOpen), xClose)
 xLow = Min(min(Low, xOpen), xClose)
ENDIF
// SUAVIZADO con la media de 2 en las velas
IF barindex>=(period+SmoothPeriod) THEN
 AvOpen=exponentialAverage[SmoothPeriod](xOpen)
 AvHigh=exponentialAverage[SmoothPeriod](xHigh)
 AvLow=exponentialAverage[SmoothPeriod](xLow)
 AvClose=exponentialAverage[SmoothPeriod](xClose)
ENDIF
// y ésta es la que uso
DRAWCANDLE(AvOpen, AvHigh, AvLow, AvClose)
//ha7 para indicar cruces
// los valores para barindex<2 son especiales
IF Barindex < SmoothPeriod then
 Opcl=Open[1]
ELSE
 Opcl=Open
ENDIF
// calculo dos medias de 7 y de 14
Media7 = Average[5](Opcl)
Media10=average[10](Opcl)
rango= Media7/8
// uso rango para el dibujo
Alcista = AvOpen<AvClose
Alcista1 = AvOpen[1]<AvClose[1]
Bajista = AvOpen>AvClose
Bajista1 = AvOpen[1]>AvClose[1]
//
//ahora calculo el Estocástico
LineaK=100*((close-lowest[Kperiod](low))/(highest[Kperiod](high)-lowest[Kperiod](low)))
K=exponentialaverage[Kspeed](LineaK)
D=exponentialaverage[Dperiod](K)
//no puede haber dos operaciones en dos dias
IF Dflech < barindex[2] then
 IF flecha<1 THEN
  IF K>D THEN
   IF (Opcl>Media7 or (Bajista1 and Alcista)) THEN
    if sar < TypicalPrice then // para evitar señales falsas
     IF (Opcl>Media7 and Opcl>Media10 and Alcista) THEN
      DRAWARROWUP (barindex, AvHigh+rango/6) COLOURED (0, 0, 255)
      flecha=1
      Dflech = barindex
     ELSIF Alcista THEN // Primer aviso
      DRAWARROWUP (barindex, AvHigh+rango/6) COLOURED (117, 248,251)
     ENDIF
    endif // cierra el tema del sar
   ENDIF
  ENDIF
 ELSIF flecha>=1 THEN
  IF K<D THEN
   IF (Opcl<Media7 or (Alcista1 and Bajista)) THEN
    if sar > close then // para evitar señales falsas
     IF (Opcl<Media7 and Opcl<Media10 and Bajista) THEN
      DRAWARROWDOWN (barindex, AvHigh+rango/6) COLOURED (255, 0, 0)
      flecha=-1
      Dflech = barindex
     ELSE //es un primer aviso
      DRAWARROWDOWN (barindex, AvHigh+rango/6) COLOURED (252, 246, 0)
     ENDIF
    endif // cierra el tema del sar
   ENDIF
  ENDIF
 ENDIF
ENDIF
// dibuja líneas en el tercer viernes de cada mes
If Dayofweek =5 and day>= 15 and Day<=21 then
 DRAWVLINE(barindex) coloured(237,96,9)
endif
//
RETURN Media7 COLOURED (0,0,255) AS "M7", Opcl-rango*0.5 COLOURED(0,0,0) as "Opcl", Media7-rango*0.5 coloured (11,74,215) as "M7", Media10-rango*0.5 COLOURED (250,48,0) AS "M10"
Download
Filename:
heikin-ashi-and-SAR-trading-system-example.png
Downloads:
417
Download
Filename:
RM-HAMod.itf
Downloads:
650
Junior
Developer by day, aspiring writer by night. Still compiling my bio... Error 404: presentation not found.
Author’s Profile
Loading...