
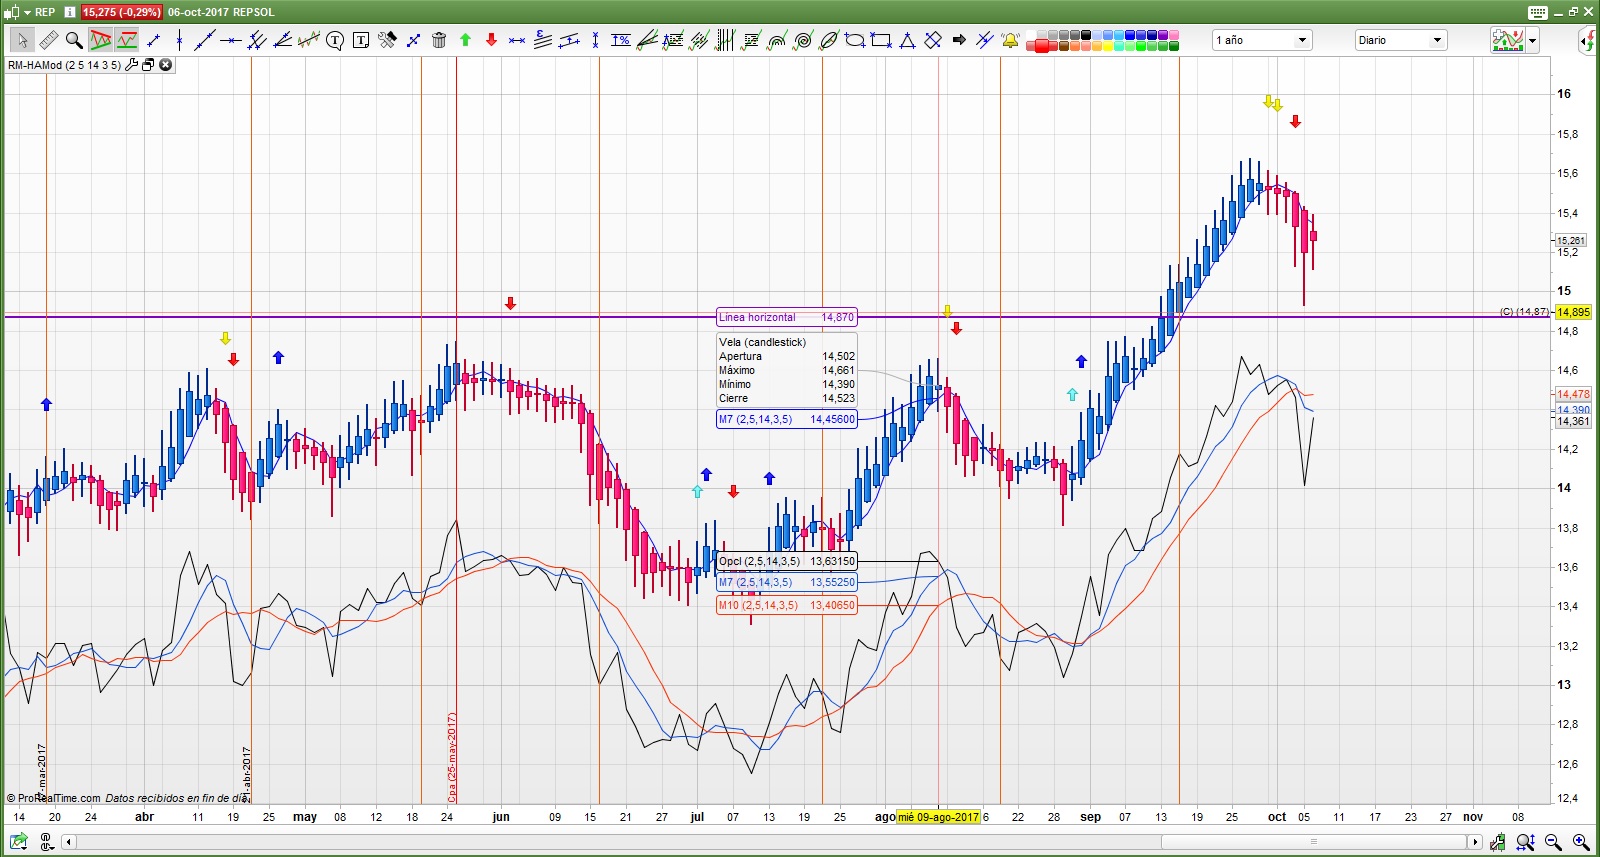
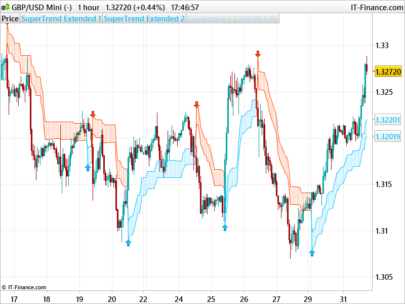
Heikin-ashi smoothed modified (from previous version) to reduce false signals. It includes SAR value to reduce false signals.
Rules in Heikin-Ashi:
1- White body sequence = upward trend.
Sequence of black bodies = downtrend.
2- Strong bullish trend = Large white bodies and no lower shadows.
Strong bearish trend = Large black bodies without upper shadows.
3- When the tendency weakens small bodies appear with possible upper and / or lower shadows.
4- A consolidation occurs when small bodies appear with both shadows both above and below.
5- The reversal of a trend can be suspected with the appearance of small bodies with both upper and lower long shadows, or a sudden change of color
|
1 2 3 4 5 6 7 8 9 10 11 12 13 14 15 16 17 18 19 20 21 22 23 24 25 26 27 28 29 30 31 32 33 34 35 36 37 38 39 40 41 42 43 44 45 46 47 48 49 50 51 52 53 54 55 56 57 58 59 60 61 62 63 64 65 66 67 68 69 70 71 72 73 74 75 76 77 78 79 80 81 82 83 84 85 86 87 88 89 90 91 92 93 94 95 |
//Reglas en Heikin-Ashi: //1- Secuencia de cuerpos verdes = tendencia alcista. // Secuencia de cuerpos rojos = tendencia bajista. //2- Tendencia alcista fuerte = Grandes cuerpos verdes y sin sombras inferiores. // Tendencia bajista fuerte = Grandes cuerpos rojos sin sombras superiores. //3- Cuando la tendencia se debilita surgen cuerpos pequeños con posibles sombras superior y/o inferior. //4- Una consolidación se da cuando aparecen cuerpos pequeños con ambas sombras tanto arriba como abajo. //5- La reversión de una tendencia se puede sospechar con la aparición de pequeños cuerpos con sombras largas tanto superiores como inferiores, o un cambio repentino de color. // parámetros //ONCE SmoothPeriod=2 valor por defecto //ONCE period=5 valor por defecto //ONCE Kperiod=5 valor por defecto //ONCE Kspeed=2 valor por defecto //ONCE Dperiod=5 valor por defecto ONCE flecha=0 ONCE Dflech=barindex ONCE xClose = (open+high+low+close)/4 ONCE xOpen = open ONCE xHigh = high ONCE xLow = low // ciclo normal IF BarIndex>0 THEN xOpen = (xOpen[1]+xClose[1])/2 xClose = (open+high+low+close)/4 xHigh = Max(max(high, xOpen), xClose) xLow = Min(min(Low, xOpen), xClose) ENDIF // SUAVIZADO con la media de 2 en las velas IF barindex>=(period+SmoothPeriod) THEN AvOpen=exponentialAverage[SmoothPeriod](xOpen) AvHigh=exponentialAverage[SmoothPeriod](xHigh) AvLow=exponentialAverage[SmoothPeriod](xLow) AvClose=exponentialAverage[SmoothPeriod](xClose) ENDIF // y ésta es la que uso DRAWCANDLE(AvOpen, AvHigh, AvLow, AvClose) //ha7 para indicar cruces // los valores para barindex<2 son especiales IF Barindex < SmoothPeriod then Opcl=Open[1] ELSE Opcl=Open ENDIF // calculo dos medias de 7 y de 14 Media7 = Average[5](Opcl) Media10=average[10](Opcl) rango= Media7/8 // uso rango para el dibujo Alcista = AvOpen<AvClose Alcista1 = AvOpen[1]<AvClose[1] Bajista = AvOpen>AvClose Bajista1 = AvOpen[1]>AvClose[1] // //ahora calculo el Estocástico LineaK=100*((close-lowest[Kperiod](low))/(highest[Kperiod](high)-lowest[Kperiod](low))) K=exponentialaverage[Kspeed](LineaK) D=exponentialaverage[Dperiod](K) //no puede haber dos operaciones en dos dias IF Dflech < barindex[2] then IF flecha<1 THEN IF K>D THEN IF (Opcl>Media7 or (Bajista1 and Alcista)) THEN if sar < TypicalPrice then // para evitar señales falsas IF (Opcl>Media7 and Opcl>Media10 and Alcista) THEN DRAWARROWUP (barindex, AvHigh+rango/6) COLOURED (0, 0, 255) flecha=1 Dflech = barindex ELSIF Alcista THEN // Primer aviso DRAWARROWUP (barindex, AvHigh+rango/6) COLOURED (117, 248,251) ENDIF endif // cierra el tema del sar ENDIF ENDIF ELSIF flecha>=1 THEN IF K<D THEN IF (Opcl<Media7 or (Alcista1 and Bajista)) THEN if sar > close then // para evitar señales falsas IF (Opcl<Media7 and Opcl<Media10 and Bajista) THEN DRAWARROWDOWN (barindex, AvHigh+rango/6) COLOURED (255, 0, 0) flecha=-1 Dflech = barindex ELSE //es un primer aviso DRAWARROWDOWN (barindex, AvHigh+rango/6) COLOURED (252, 246, 0) ENDIF endif // cierra el tema del sar ENDIF ENDIF ENDIF ENDIF // dibuja líneas en el tercer viernes de cada mes If Dayofweek =5 and day>= 15 and Day<=21 then DRAWVLINE(barindex) coloured(237,96,9) endif // RETURN Media7 COLOURED (0,0,255) AS "M7", Opcl-rango*0.5 COLOURED(0,0,0) as "Opcl", Media7-rango*0.5 coloured (11,74,215) as "M7", Media10-rango*0.5 COLOURED (250,48,0) AS "M10" |
Share this
No information on this site is investment advice or a solicitation to buy or sell any financial instrument. Past performance is not indicative of future results. Trading may expose you to risk of loss greater than your deposits and is only suitable for experienced investors who have sufficient financial means to bear such risk.
ProRealTime ITF files and other attachments :
Find other exclusive trading pro-tools on ![]()
PRC is also on YouTube, subscribe to our channel for exclusive content and tutorials


Buenas noches, es posible que transforma este código en un screener? Gracias.Seria mas fácil para identificar les entradas.
Je ne suis pas expert avec screeners, mais je pense que si vous ajoute a RETURN la variable Flecha vous la pouvez utiliser pour le screener.
Merci an avant
Would be nice a screener about this, my knowledge about coding still limited
for those who have requested a screener I attach one I have tested.
//Reglas en Heikin-Ashi:
//1- Secuencia de cuerpos verdes = tendencia alcista.
// Secuencia de cuerpos rojos = tendencia bajista.
//2- Tendencia alcista fuerte = Grandes cuerpos verdes y sin sombras inferiores.
// Tendencia bajista fuerte = Grandes cuerpos rojos sin sombras superiores.
//3- Cuando la tendencia se debilita surgen cuerpos pequeños con posibles sombras superior y/o inferior.
//4- Una consolidación se da cuando aparecen cuerpos pequeños con ambas sombras tanto arriba como abajo.
//5- La reversión de una tendencia se puede sospechar con la aparición de pequeños cuerpos con sombras largas tanto superiores como inferiores, o un cambio repentino de color.
// parámetros
ONCE SmoothPeriod=2
ONCE period=5
ONCE Kperiod=5
ONCE Kspeed=2
ONCE Dperiod=5
ONCE entrada=0
ONCE salida=0
ONCE flecha=0
ONCE Dflech=barindex
ONCE xClose = (open+high+low+close)/4
ONCE xOpen = open
// ciclo normal
IF BarIndex>0 THEN
xOpen = (xOpen[1]+xClose[1])/2
xClose = (open+high+low+close)/4
ENDIF
// SUAVIZADO con la media de 2 en las velas
IF barindex>=(period+SmoothPeriod) THEN
AvOpen=exponentialAverage[SmoothPeriod](xOpen)
AvClose=exponentialAverage[SmoothPeriod](xClose)
ENDIF
// y ésta es la que uso
//ha7 para indicar cruces
// los valores para barindex<2 son especiales
IF Barindex < SmoothPeriod then
Opcl=Open[1]
ELSE
Opcl=Open
ENDIF
// calculo dos medias de 7 y de 14
Media7 = Average[5](Opcl)
Media10=average[10](Opcl)
Alcista = AvOpen<AvClose
Alcista1 = AvOpen[1]AvClose
Bajista1 = AvOpen[1]>AvClose[1]
//
//ahora calculo el Estocástico
LineaK=100*((close-lowest[Kperiod](low))/(highest[Kperiod](high)-lowest[Kperiod](low)))
K=exponentialaverage[Kspeed](LineaK)
D=exponentialaverage[Dperiod](K)
//no puede haber dos operaciones en dos dias
IF Dflech < barindex[2] then
IF flechaD THEN
IF (Opcl>Media7 or (Bajista1 and Alcista)) THEN
if sar Media7 and Opcl>Media10 and Alcista) THEN
flecha=1
Dflech = barindex
entrada=1
ENDIF
endif // cierra el tema del sar
ENDIF
ENDIF
ELSIF flecha>=1 THEN
IF K<D THEN
IF (Opcl close then // para evitar señales falsas
IF (Opcl<Media7 and Opcl<Media10 and Bajista) THEN
flecha=-1
Dflech = barindex
Salida=1
ENDIF
endif // cierra el tema del sar
ENDIF
ENDIF
ENDIF
ENDIF
// dibuja líneas en el tercer viernes de cada mes
// Condiciones para entrada de posiciones largas
IF NOT LongOnMarket AND entrada=1 THEN
entrada=0
BUY 1 CONTRACTS AT MARKET
ENDIF
// Condiciones de salida de posiciones largas
If LongOnMarket AND salida=1 THEN
SELL AT MARKET
salida=0
ENDIF
I have modified some lines and it seems this version will work better. Even so, I recommend to test with different sets of values for the variables declared at ONCE and, mainly, not to use this indicator stand alone as automatic system to put orders. It works different accordingly to the stock values and from my point of view this is dangerous.
ONCE SmoothPeriod=2
ONCE period=5
ONCE Kperiod=14
ONCE Kspeed=3
ONCE Dperiod=5
ONCE flecha=0
ONCE Dflech=barindex
ONCE xClose = (open+high+low+close)/4
ONCE xOpen = open
// ciclo normal
IF BarIndex>0 THEN
xOpen = (xOpen[1]+xClose[1])/2
xClose = (open+high+low+close)/4
ENDIF
// SUAVIZADO con la media de 2 en las velas
IF barindex>=(period+SmoothPeriod) THEN
AvOpen=exponentialAverage[SmoothPeriod](xOpen)
AvClose=exponentialAverage[SmoothPeriod](xClose)
ENDIF
// y ésta es la que uso
//ha7 para indicar cruces
// los valores para barindex<2 son especiales
IF Barindex < SmoothPeriod then
Opcl=Open[1]
ELSE
Opcl=Open
ENDIF
// calculo dos medias de 7 y de 14
Media7 = Average[5](Opcl)
Media10=average[10](Opcl)
Alcista = AvOpen<AvClose
Alcista1 = AvOpen[1]AvClose
Bajista1 = AvOpen[1]>AvClose[1]
//
//ahora calculo el Estocástico
LineaK=100*((close-lowest[Kperiod](low))/(highest[Kperiod](high)-lowest[Kperiod](low)))
K=exponentialaverage[Kspeed](LineaK)
D=exponentialaverage[Dperiod](K)
//no puede haber dos operaciones en dos dias
IF Dflech < barindex[2] then
IF flechaD THEN
IF (Opcl>Media7 or (Bajista1 and Alcista)) THEN
if sar Media7 and Opcl>Media10 and Alcista) THEN
flecha=1
Dflech = barindex
//ENDIF
endif // cierra el tema del sar
ENDIF
ENDIF
ELSIF flecha>=1 THEN
IF K<D THEN
IF (Opcl close then // para evitar señales falsas
IF (Opcl<Media7 and Opcl<Media10 and Bajista) THEN
flecha=-1
Dflech = barindex
ENDIF
endif // cierra el tema del sar
ENDIF
ENDIF
ENDIF
ENDIF
// dibuja líneas en el tercer viernes de cada mes
// Condiciones para entrada de posiciones largas
IF NOT LongOnMarket AND flecha=1 THEN
BUY 1000 CONTRACTS AT MARKET
ENDIF
// Condiciones de salida de posiciones largas
If LongOnMarket AND flecha=-1 THEN
SELL AT MARKET
ENDIF
Guten Tag, gibt es eine Möglichkeit sich den genauen Auslösepunkt der Signale anzuzeigen damit man diese Strategie manuell zu testen? Oder hat sie von euch schon einer automatisiert ? danke
Here it is the screener. (sorry I don’t speak german).
//Reglas en Heikin-Ashi:
//1- Secuencia de cuerpos verdes = tendencia alcista.
// Secuencia de cuerpos rojos = tendencia bajista.
//2- Tendencia alcista fuerte = Grandes cuerpos verdes y sin sombras inferiores.
// Tendencia bajista fuerte = Grandes cuerpos rojos sin sombras superiores.
//3- Cuando la tendencia se debilita surgen cuerpos pequeños con posibles sombras superior y/o inferior.
//4- Una consolidación se da cuando aparecen cuerpos pequeños con ambas sombras tanto arriba como abajo.
//5- La reversión de una tendencia se puede sospechar con la aparición de pequeños cuerpos con sombras largas tanto superiores como inferiores, o un cambio repentino de color.
// parámetros
ONCE SmoothPeriod=2
ONCE period=5
ONCE Kperiod=5
ONCE Kspeed=2
ONCE Dperiod=5
ONCE entrada=0
ONCE salida=0
ONCE flecha=0
ONCE Dflech=barindex
ONCE xClose = (open+high+low+close)/4
ONCE xOpen = open
// ciclo normal
IF BarIndex>0 THEN
xOpen = (xOpen[1]+xClose[1])/2
xClose = (open+high+low+close)/4
ENDIF
// SUAVIZADO con la media de 2 en las velas
IF barindex>=(period+SmoothPeriod) THEN
AvOpen=exponentialAverage[SmoothPeriod](xOpen)
AvClose=exponentialAverage[SmoothPeriod](xClose)
ENDIF
// y ésta es la que uso
//ha7 para indicar cruces
// los valores para barindex<2 son especiales
IF Barindex < SmoothPeriod then
Opcl=Open[1]
ELSE
Opcl=Open
ENDIF
// calculo dos medias de 7 y de 14
Media7 = Average[5](Opcl)
Media10=average[10](Opcl)
Alcista = AvOpen<AvClose
Alcista1 = AvOpen[1]AvClose
Bajista1 = AvOpen[1]>AvClose[1]
//
//ahora calculo el Estocástico
LineaK=100*((close-lowest[Kperiod](low))/(highest[Kperiod](high)-lowest[Kperiod](low)))
K=exponentialaverage[Kspeed](LineaK)
D=exponentialaverage[Dperiod](K)
//no puede haber dos operaciones en dos dias
IF Dflech < barindex[2] then
IF flechaD THEN
IF (Opcl>Media7 or (Bajista1 and Alcista)) THEN
if sar Media7 and Opcl>Media10 and Alcista) THEN
flecha=1
Dflech = barindex
entrada=1
ENDIF
endif // cierra el tema del sar
ENDIF
ENDIF
ELSIF flecha>=1 THEN
IF K<D THEN
IF (Opcl close then // para evitar señales falsas
IF (Opcl<Media7 and Opcl<Media10 and Bajista) THEN
flecha=-1
Dflech = barindex
Salida=1
ENDIF
endif // cierra el tema del sar
ENDIF
ENDIF
ENDIF
ENDIF
// dibuja líneas en el tercer viernes de cada mes
// Condiciones para entrada de posiciones largas
IF NOT LongOnMarket AND entrada=1 THEN
entrada=0
BUY 1 CONTRACTS AT MARKET
ENDIF
// Condiciones de salida de posiciones largas
If LongOnMarket AND salida=1 THEN
SELL AT MARKET
salida=0
ENDIF
Bonsoir. Je ne comprends pas très bien l’utilité de la variable “FLECHA” et je ne suis pas un expert en screener. Si quelqu’un veut bien nous aider, ce sera avec plaisir.
Variable flecha est utilisé pour connaître si je suis a le système ou non.et aussi si j’avais montré a fleche ascendent ou décroissant.
aussi le screener.
//Reglas en Heikin-Ashi:
//1- Secuencia de cuerpos verdes = tendencia alcista.
// Secuencia de cuerpos rojos = tendencia bajista.
//2- Tendencia alcista fuerte = Grandes cuerpos verdes y sin sombras inferiores.
// Tendencia bajista fuerte = Grandes cuerpos rojos sin sombras superiores.
//3- Cuando la tendencia se debilita surgen cuerpos pequeños con posibles sombras superior y/o inferior.
//4- Una consolidación se da cuando aparecen cuerpos pequeños con ambas sombras tanto arriba como abajo.
//5- La reversión de una tendencia se puede sospechar con la aparición de pequeños cuerpos con sombras largas tanto superiores como inferiores, o un cambio repentino de color.
// parámetros
ONCE SmoothPeriod=2
ONCE period=5
ONCE Kperiod=5
ONCE Kspeed=2
ONCE Dperiod=5
ONCE entrada=0
ONCE salida=0
ONCE flecha=0
ONCE Dflech=barindex
ONCE xClose = (open+high+low+close)/4
ONCE xOpen = open
// ciclo normal
IF BarIndex>0 THEN
xOpen = (xOpen[1]+xClose[1])/2
xClose = (open+high+low+close)/4
ENDIF
// SUAVIZADO con la media de 2 en las velas
IF barindex>=(period+SmoothPeriod) THEN
AvOpen=exponentialAverage[SmoothPeriod](xOpen)
AvClose=exponentialAverage[SmoothPeriod](xClose)
ENDIF
// y ésta es la que uso
//ha7 para indicar cruces
// los valores para barindex<2 son especiales
IF Barindex < SmoothPeriod then
Opcl=Open[1]
ELSE
Opcl=Open
ENDIF
// calculo dos medias de 7 y de 14
Media7 = Average[5](Opcl)
Media10=average[10](Opcl)
Alcista = AvOpen<AvClose
Alcista1 = AvOpen[1]AvClose
Bajista1 = AvOpen[1]>AvClose[1]
//
//ahora calculo el Estocástico
LineaK=100*((close-lowest[Kperiod](low))/(highest[Kperiod](high)-lowest[Kperiod](low)))
K=exponentialaverage[Kspeed](LineaK)
D=exponentialaverage[Dperiod](K)
//no puede haber dos operaciones en dos dias
IF Dflech < barindex[2] then
IF flechaD THEN
IF (Opcl>Media7 or (Bajista1 and Alcista)) THEN
if sar Media7 and Opcl>Media10 and Alcista) THEN
flecha=1
Dflech = barindex
entrada=1
ENDIF
endif // cierra el tema del sar
ENDIF
ENDIF
ELSIF flecha>=1 THEN
IF K<D THEN
IF (Opcl close then // para evitar señales falsas
IF (Opcl<Media7 and Opcl<Media10 and Bajista) THEN
flecha=-1
Dflech = barindex
Salida=1
ENDIF
endif // cierra el tema del sar
ENDIF
ENDIF
ENDIF
ENDIF
// dibuja líneas en el tercer viernes de cada mes
// Condiciones para entrada de posiciones largas
IF NOT LongOnMarket AND entrada=1 THEN
entrada=0
BUY 1 CONTRACTS AT MARKET
ENDIF
// Condiciones de salida de posiciones largas
If LongOnMarket AND salida=1 THEN
SELL AT MARKET
salida=0
ENDIF
Muchas gracias. Have a good day.
Anyway so the arrows aren’t so hight compared to the candles ? Can’t see any offset
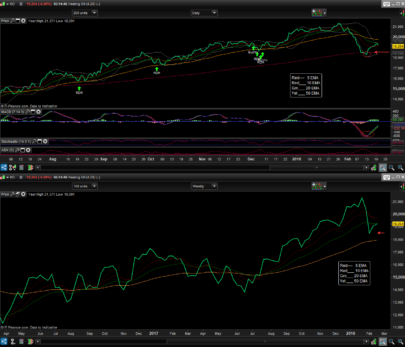
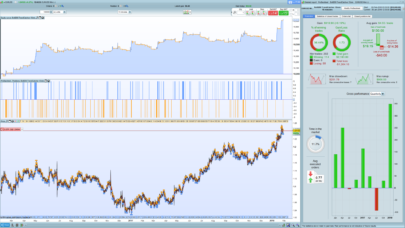
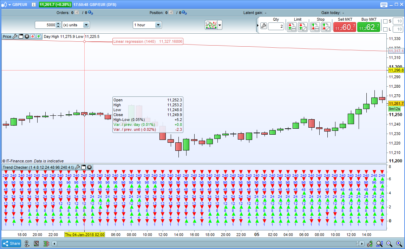
For the last who liked the code I suggest this new one: /. para los que han dado like al indicador, les sugiero estas modificaciones:
using linear regression for flat periods. /. usando regresión lineal para los períodos de tendencia lateral.
//Reglas en Heikin-Ashi:
//1- Secuencia de cuerpos verdes = tendencia alcista.
// Secuencia de cuerpos rojos = tendencia bajista.
//2- Tendencia alcista fuerte = Grandes cuerpos verdes y sin sombras inferiores.
// Tendencia bajista fuerte = Grandes cuerpos rojos sin sombras superiores.
//3- Cuando la tendencia se debilita surgen cuerpos pequeños con posibles sombras superior y/o inferior.
//4- Una consolidación se da cuando aparecen cuerpos pequeños con ambas sombras tanto arriba como abajo.
//5- La reversión de una tendencia se puede sospechar con la aparición de pequeños cuerpos con sombras largas tanto superiores como inferiores, o un cambio repentino de color.
//
// Tener siempre en cuenta que las flechas salen a cierre del día
ONCE flechaup = 1
ONCE flechadn = 1
ONCE salida=0 // para evitar entradas y salidas
ONCE entrada=0 // seguidas.
//
//para la primera vez calculo valores iniciales
ONCE xOpen = (open+close)/2
ONCE xClose = (open+high+low+close)/4
ONCE xHigh = MAX(high,MAX(xOpen,xClose))
ONCE xLow = MIN(low,MIN(xOpen,xClose))
ONCE comienzo=xopen
// ciclo normal basado en los anteriores
// cálculo de los valores de la vela Heikin-ashi
IF BarIndex>0 THEN
xOpen = (xOpen[1]+xClose[1])/2
xClose = (open+high+low+close)/4
xHigh = MAX(high, MAX(xOpen, xClose))
xLow = MIN(Low,MIN(xOpen, xClose))
ENDIF
DRAWCANDLE(xOpen, xHigh, xLow, xClose)
// Calculo el estocástico
lineaK=100*((close-lowest[10](low))/(highest[10](high)-lowest[10](low)))
K=exponentialaverage[3](lineaK)
D=exponentialaverage[5](K)
//Media retardo cero de las velas HA
C1=exponentialaverage[media](xclose)
C2=exponentialaverage[media](C1)
MR0=c1+(c1-c2)
// uso rango para el dibujo
vAlcista = xOpen<xClose
vAlcista1 = xOpen[1]xClose
vBajista1 = xOpen[1]>xClose[1]
doji=(ABS(((xopen-xclose)/(xhigh-xlow)))-margen)and(MLRxclose[1] and Xhigh>xhigh[1]
//Tendbajf = xclose<xclose[1] and xhigh<xhigh[1]
Debtendalc= (ATAN((xclose/xclose[1])-1)<0 or (ATAN((xhigh/xhigh[1])-1)<0))
debtendbaj= (ATAN((xclose[1]/xclose)-1)<0 or (ATAN((xlow[1]/xlow)-1) la vela alcista pierde fuerza y estoy largo
condas1 = debtendalc and flechaup=1
if Condas1 and amorfo2 then
DRAWARROWDOWN(barindex, xHigh+distancia*1.1) COLOURED (252,246,0) // AMARILLO
endif
// Condiciones de salida
// cambia de alcista a bajista y rompe la MR0
conds1= (vbajista and valcista1 and xclose<mr0 and K<D) and flechaup=1
// cambia a bajista y se habia debilitado
conds2= (vbajista and (valcista1 or debtendalc[1]) and flechaup=1)
// cambioa a bajista y continua
conds3 = (vbajista and vbajista1 and xclose entrada)
// primero por si fuese aviso
IF (conds1 or conds2 or conds3) and conds4 and not doji THEN
if not amorfo then
DRAWARROWDOWN(barindex, xHigh+distancia*1.1) COLOURED (255, 0, 0) // ROJO
flechadn=1 // me he salido
flechaup=0 // puedo volver a entrar
salida=barindex // cuando ha salido
entrada=0
// dibujo la ganancia vendiendo al cierre.
ganper=xclose-comienzo
Porcen=(ganper/comienzo*100)
TXTGAN = round(ganper*100)/100
TXTPor = Round(Porcen*100)/100
DRAWTEXT(TXTGAN, barindex, xlow-distancia*1.2)
drawtext(TXTPor, barindex, xlow-distancia*1.4)
DRAWsegment(barindex,xlow-distancia, barindex, Xlow-distancia*1.2) coloured (0,0,0)
endif
endif
// ahora veo cuando entro
// dos velas alcistas viniendo de una bajista es entrada en azul claro
// condiciones de entrada a un valor:
Condaent1 = (valcista or debtendbaj) and xclose>mr0 and flechadn=1
if Condaent1 then
DRAWARROWUP(barindex, xlow-distancia) COLOURED (32,240,228)
endif
// vela alcista estocastico ok y cierre > mr0
Condent1 = (valcista and k>D and xclose>mr0) and flechadn=1
//
Condent2 = valcista and valcista1 and flechadn=1
//
Condent3 = barindex-diasidle >= salida
//
IF (Condent1 and Condent2) and Condent3 THEN
If not doji then // no sea un doji
DRAWARROWUP(barindex, xlow-distancia) COLOURED (0, 0, 255) // AZUL
flechaup=1
flechadn=0
entrada=barindex
salida=0
comienzo=xopen // (open+close)/2–>un precio medio
endif
endif
//
If Dayofweek =5 and day>= 15 and Day<=21 then
DRAWVLINE(barindex) coloured(237,96,9)
endif
RETURN MR0 as "mr0"
I can’t find the part of the Code which detects when the first large white bodies and no lower shadows/Large black bodies without upper shadows. Can someone help me please ? Thanks !
is not taken into account in the procedure. It considers only if it is a doji or when candles are white / black. Strategy is based on the change of candle types.
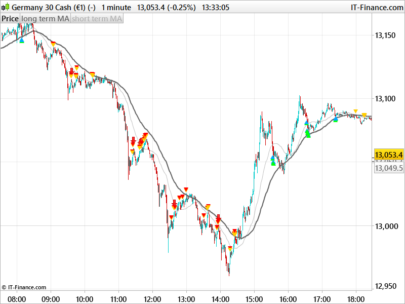
Okay thanks, just a question : how do you plot your two lines in the same window as price ? The lines are the 5 MA and the price ? Thanks a lot
sorry, I don’t understand your question. Indicator draws Heikin Ashi candle, not price candle which is different.
In this way, you can draw any line you want using return command. see “RETURN MR0 as “mr0″”.
same occurs with the vertical line for the third Friday of the month.