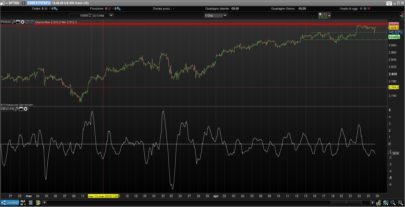
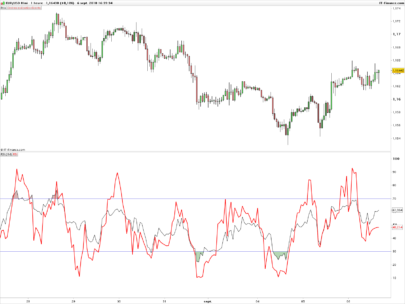
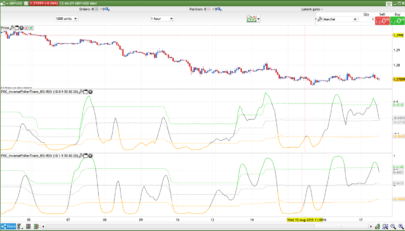
The Cybernetic Oscillator is a zero-centered, energy-normalized momentum oscillator inspired by John Ehlers’ digital signal processing work. It combines a high-pass filter to remove drift, a 2nd-order Super Smoother to reduce noise, and RMS normalization so the amplitude remains comparable across markets and timeframes. The result is a responsive, clean oscillator that highlights direction changes and strength without being dominated by raw volatility.
Key Features at a Glance
- Band-pass behavior: High-pass → Super Smoother low-pass chain isolates tradable swings.
- RMS normalization: Divides by rolling RMS of the filtered signal to stabilize amplitude.
- Zero-centered: Clear polarity around the 0-line for bias flips.
- Threshold bands (±1 by default): Optional gating for “strong” moves.
- Polarity coloring: Green above zero, red below, for instant read.
Intuition First: The Signal Pipeline
Price → remove trend with a 2nd-order High-Pass → reduce noise via 2nd-order Super Smoother → scale by RMS of recent energy → plot oscillator with zero line and ±thresholds.
- The HP filter strips slow drift so momentum flips are timely.
- The Super Smoother suppresses jitter without excessive lag.
- RMS normalization keeps values consistent, making ±1 a meaningful, portable reference.
Formula Breakdown
- High-Pass (2nd order)
- Frequency set by
hpPeriod. Coefficients useexp,cosand π to emulate a digital HP. - Output:
hp, removing low-frequency drift.
- Frequency set by
- Super Smoother (2nd order Low-Pass)
- Frequency set by
lpPeriod. Applied to the average ofhpandhp[1]to reduce phase noise. - Output:
lp, a smooth band-passed signal.
- Frequency set by
- RMS Normalization
- Compute rolling RMS over
rmsLenoflp². - Normalize:
osc = lp / max(rms, ε)so amplitude ≈ 1 in steady conditions.
- Compute rolling RMS over
- Display & Thresholds
- Plot
osc, zero line, and optional±threshold. - Dynamic color: green above zero, red below.
- Plot
Inputs & Defaults
hpPeriod= 30
Controls how aggressively drift is removed.- Shorter (15–25): faster bias flips, more whipsaws.
- Longer (35–50): steadier bias, slower to turn.
lpPeriod= 20
Governs smoothing of the high-pass output.- Shorter (10–16): snappier but noisier.
- Longer (22–30): calmer but laggier.
rmsLen= 100
Window for energy normalization.- Shorter (50–80): amplitude adapts quickly to volatility shifts.
- Longer (120–200): more stable scaling across regimes.
threshold= 1
Optional gating for “strong” moves.- Raise to 1.25–1.5 in choppy markets to reduce false positives.
- Lower to 0.7–0.9 to be more permissive.
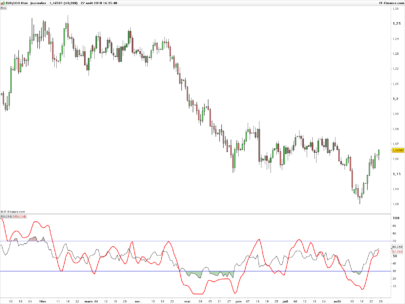
How to Read the Oscillator
- Zero-line flips: Crossing above 0 suggests bullish momentum bias; below 0 suggests bearish.
- Threshold zones: Moves beyond
+thresholdor below-thresholdindicate stronger impulses. - Divergences: Price making new extremes while
oscfails to confirm often precedes momentum fades. - Regime awareness: In strong trends, pullbacks may stall near the zero line; in ranges, price mean-reverts around zero more frequently.
Tip: Treat ±threshold as context, not absolute signals. Combine with trend/volatility filters.
Trading Playbooks (Examples, Not Advice)
- Momentum Flip
- Entry: Bias flip through zero in trend direction (e.g., price above a slow MA, oscillator crosses > 0).
- Exit: First loss of momentum back through zero or trail with ATR.
- Use threshold: If the first push also clears
+threshold, allow a wider stop; otherwise, be tighter.
- Pullback Continuation
- Uptrend: After a dip above
-threshold, look foroscto curl back up and cross zero. - Downtrend: Mirror logic with +threshold.
- Idea: Avoid deeper counter-trend swings that pierce the opposite threshold.
- Uptrend: After a dip above
- Range Mean-Reversion
- In sideways regimes, fade moves that tag ±threshold when price is at range extremes.
- Exit near the zero line or mid-range.
Risk management: Always define invalidation (e.g., ATR-based stops or swing points) and position sizing before entries.
Best Practices & Common Pitfalls
- Don’t over-filter: Very long
hpPeriod + lpPeriodcan mute useful signals. - Keep RMS realistic: Too small
rmsLencan inflate amplitude after brief shocks. - Mind regime shifts: Re-tune
thresholdwhen volatility regime changes. - Use confirmations: Pair zero-cross ideas with a simple regime filter (e.g., MA slope) and a volatility filter (e.g., ATR percentile) to decide whether to run momentum or mean-reversion playbooks.
Code (ProBuilder)
|
1 2 3 4 5 6 7 8 9 10 11 12 13 14 15 16 17 18 19 20 21 22 23 24 25 26 27 28 29 30 31 32 33 34 35 36 37 38 39 40 41 42 43 44 45 46 47 48 49 50 51 52 53 54 55 56 57 58 59 60 61 62 63 64 65 66 |
// ==================================================== //PRC_Cybernetic Oscillator (John Ehlers, TASC 2025) //version = 0 //01.10.25 //Iván González @ www.prorealcode.com //Sharing ProRealTime knowledge // ==================================================== // ----- Parámetros hpPeriod = 30 // Periodo filtro Highpass lpPeriod = 20 // Periodo filtro Lowpass (Super Smoother) rmsLen = 100 // Longitud RMS threshold = 1 // Umbral opcional // ----- Constantes pi = 3.1415926535 sqrt2 = 1.41421356237 src = close // ==================================================== // Calculos // ==================================================== if barindex>=4 then // ----- High-Pass Filter (2nd order) a0 = sqrt2 * pi / hpPeriod a1 = EXP(-a0) c2hp = 2*a1*COS(a0*180/pi) c3hp = -(a1*a1) c1hp = (1 + c2hp - c3hp) * 0.25 hp = 0 hp = c1hp * (src - 2*src[1] + src[2]) + c2hp*hp[1] + c3hp*hp[2] // ----- Super Smoother (Low-Pass, 2nd order) a0lp = sqrt2 * pi / lpPeriod a1lp = EXP(-a0lp) c2lp = 2*a1lp*COS(a0lp*180/pi) c3lp = -(a1lp*a1lp) c1lp = 1 - c2lp - c3lp lp = 0 lp = c1lp * 0.5*(hp + hp[1]) + c2lp*lp[1] + c3lp*lp[2] endif // ==================================================== // RMS Normalization // ==================================================== pow2 = lp*lp rms = SQRT(Average[rmsLen](pow2)) epsilon = 0.000001 den = MAX(rms, epsilon) osc = lp / den // ==================================================== // Líneas de referencia // ==================================================== zeroline = 0 upth = threshold lowth = -threshold if osc > 0 then red=0 green=255 blue=0 else red=255 green=0 blue=0 endif // ==================================================== RETURN osc AS "Cybernetic Osc" coloured(red,green,blue)style(histogram),zeroline COLOURED(200,200,200) AS "0",upth COLOURED(150,150,150) AS "+Threshold",lowth COLOURED(150,150,150) AS "-Threshold" |
Share this
No information on this site is investment advice or a solicitation to buy or sell any financial instrument. Past performance is not indicative of future results. Trading may expose you to risk of loss greater than your deposits and is only suitable for experienced investors who have sufficient financial means to bear such risk.
ProRealTime ITF files and other attachments :
Find other exclusive trading pro-tools on ![]()
PRC is also on YouTube, subscribe to our channel for exclusive content and tutorials


Hello Ivan, I see that you are very good in PRT coding. Is it possible to have a code who searchs absorptions ? I think we have now the possibility to read volume exchange per price with PRT DOM but I don’t know if there are coding instructions for that.
Thank you for your very good you work.
Hi. It is not possible to detect true absorptions with ProBuilder code. The PRT language does not provide access to order book (DOM) data or volume per price. Only bar volume and tick volume are available.
Bonjour Ivan je suis à la recherche d’ un indicateur pour avoir des points d’ entrées et de sorties sur le secteur BIOTECH ( actions avec beaucoup de volume ) ou moyenne mobile sur prix !!! merci pour ton aide