







Ehlers Inverse Fisher Transform of RSI or RSX
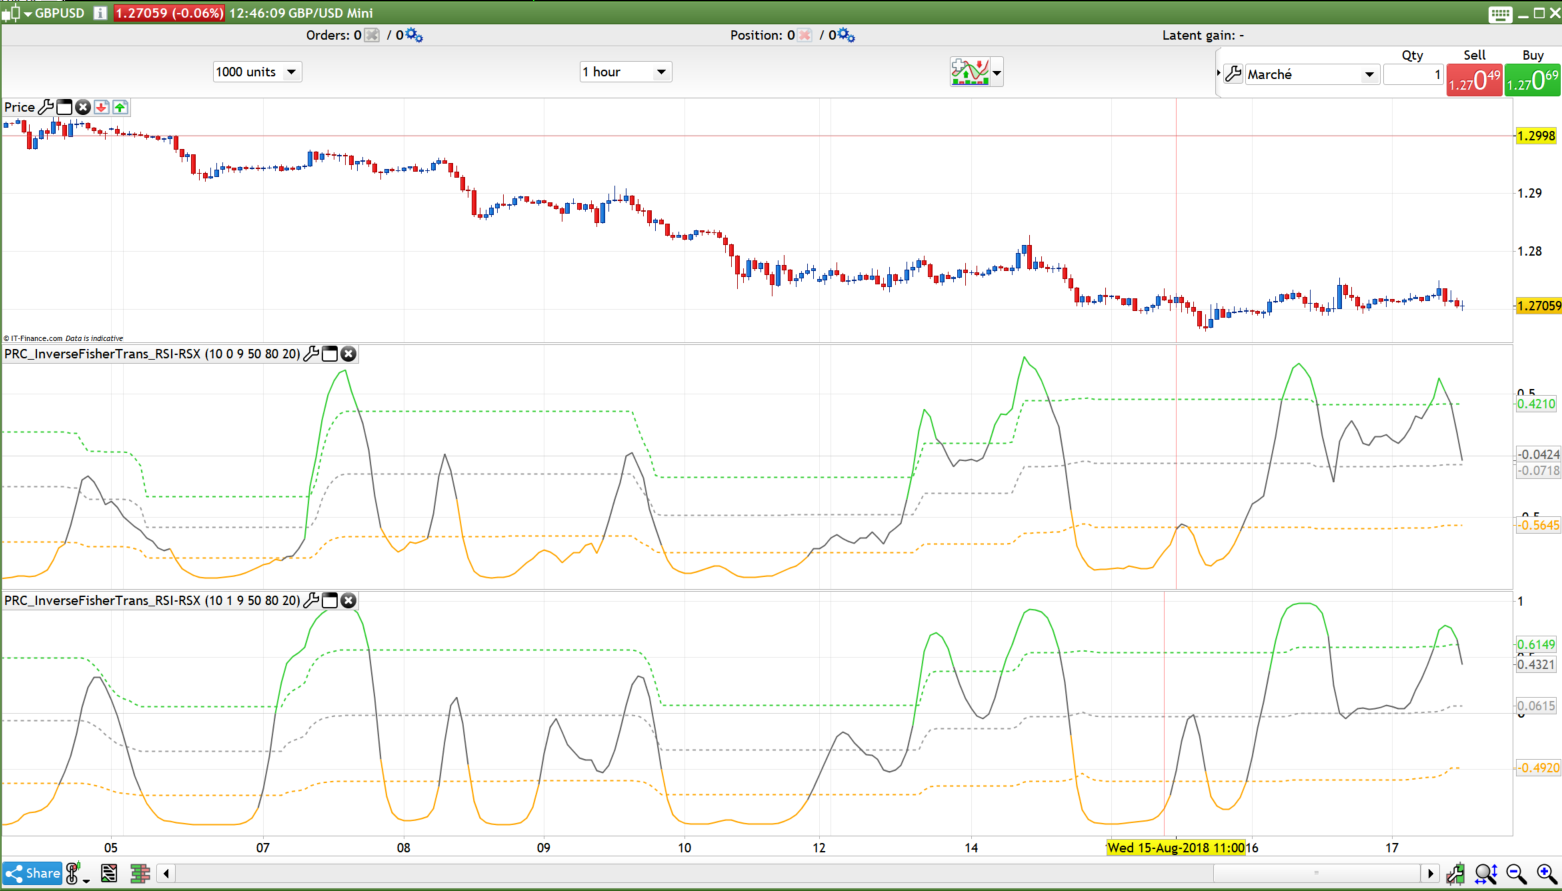
Published in the Technical Analysis of Stocks and Commodities magazine in the May 2004 issue, the inverse fisher transform is an indicator created by John Ehlers. The Inverse Fisher Transform was developed to help traders and investors with their timing decisions to buy and sell securities. It does this by altering the probability distribution function (PDF) of any indicator and makes it appear smoother.
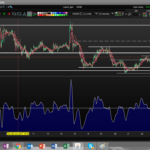
This version include the inverse fisher transform calculation method applied on the RSI (upper oscillator in the screenshot) or the RSX (lower oscillator in the attached picture).
Settings explained:
- RsiPeriod: Period of RSI or RSX oscillator
- RsiMethod: 0=RSI 1=RSX
- SmoothPeriod: Smoothing period applied on the oscillator with a linear weighted average
- MinMaxPeriod: period of highest high / lowest low to calculate the dynamic overbough/oversold levels
- LevelUp: percentage of the overbought upper level
- LevelDown: percentage of the oversold lower level
//PRC_InverseFisherTrans_RSI-RSX | indicator
//17.08.2018
//Nicolas @ www.prorealcode.com
//Sharing ProRealTime knowledge

// --- settings
RsiPeriod       = 10 // RSI period
RsiMethod       = 1 // Rsi method (0=RSI, 1=RSX)
SmoothPeriod    = 9 // Smoothing period
MinMaxPeriod    = 50 // Floating levels period (<= 1 for fixed levels)
LevelUp         = 80.0 // Up level %
LevelDown       = 20.0 // Down level %
// --- end of settings

RsiPrice        = customclose // Price
if barindex>RsiPeriod then
 smallRsiValue = 0.0000000000000001
 if RsiMethod=0 then
  //RSI
  alpha = 1.0/Max(RsiPeriod,1)
  change = RsiPrice-RsiPrice[1]
  workRsichange = workRsichange[1] + alpha*( change  - workRsichange[1])
  workRsichanga = workRsichanga[1] + alpha*(Abs(change) - workRsichanga[1])
  iRsi = (50.0*(workRsichange/Max(workRsichanga,smallRsiValue)+1))
 else
  //RSX
  Len=rsiperiod

  if (f90 = 0.0) then
   f90 = 1.0
   f0 = 0.0
   if (Len-1 >= 5) then
    f88 = Len-1.0
   else
    f88 = 5.0
   endif
   f8 = 100.0*(rsiprice)
   f18 = 3.0 / (Len + 2.0)
   f20 = 1.0 - f18
  else
   if (f88 <= f90) then
    f90 = f88 + 1
   else
    f90 = f90 + 1
   endif
   f10 = f8
   f8 = 100*Close
   v8 = f8 - f10
   f28 = f20 * f28 + f18 * v8
   f30 = f18 * f28 + f20 * f30
   vC = f28 * 1.5 - f30 * 0.5
   f38 = f20 * f38 + f18 * vC
   f40 = f18 * f38 + f20 * f40
   v10 = f38 * 1.5 - f40 * 0.5
   f48 = f20 * f48 + f18 * v10
   f50 = f18 * f48 + f20 * f50
   v14 = f48 * 1.5 - f50 * 0.5
   f58 = f20 * f58 + f18 * Abs(v8)
   f60 = f18 * f58 + f20 * f60
   v18 = f58 * 1.5 - f60 * 0.5
   f68 = f20 * f68 + f18 * v18

   f70 = f18 * f68 + f20 * f70
   v1C = f68 * 1.5 - f70 * 0.5
   f78 = f20 * f78 + f18 * v1C
   f80 = f18 * f78 + f20 * f80
   v20 = f78 * 1.5 - f80 * 0.5

   if ((f88 >= f90) and (f8 <> f10)) then
    f0 = 1.0
   endif
   if ((f88 = f90) and (f0 = 0.0)) then
    f90 = 0.0
   endif
  endif


  if ((f88 < f90) and (v20 > smallRsiValue)) then

   v4 = (v14 / v20 + 1.0) * 50.0
   if (v4 > 100.0) then
    v4 = 100.0
   endif
   if (v4 < 0.0) then
    v4 = 0.0
   endif
  else
   v4 = 50.0
  endif

  irsi=v4
 endif

 //linear weighted moving average
 sumw = smoothperiod
 sum  = smoothperiod*(0.1*(iRsi-50))
 workLwma = (0.1*(iRsi-50))
 for k=1 to smoothperiod-1 do
  weight = smoothperiod-k
  sumw  = sumw + weight
  sum   = sum+(weight*workLwma[k])
 next
 trss = (sum/sumw)

 //oscillator final cut
 e = 2.7182818284590452353602874713527
 y = exp((2.0*trss)*log(e))
 rsii=(y-1.0)/(y+1.0)

 //levels
 mmin = rsii
 mmax = rsii
 for k=1 to MinMaxPeriod-1 do
  mmin=min(rsii[k],mmin)
  mmax=max(rsii[k],mmax)
 next
 rrange = mmax-mmin
 levelupz = mmin+LevelUp * rrange/100
 leveldnz = mmin+LevelDown * rrange/100
 levelmi = mmin+0.5*rrange

 //Color
 r=100
 g=100
 b=100
 if rsii>levelupz then
  r=50
  g=205
  b=50
 elsif rsii<leveldnz then
  r=255
  g=165
  b=0
 endif
endif

return levelupz coloured(50,205,50) style(dottedline,2) as "Level Up", leveldnz coloured(255,165,0) style(dottedline,2) as "Level Down", levelmi coloured(155,155,155) style(dottedline,2) as "mid level", rsii coloured(r,g,b) style(line,2) as "RSI"
Comments
You must be logged in to post a comment.

Grazie del prezioso contributo Nicolas, scusa la mia inesperienza, sono alle prime armi e sto imparando. Volevo farti una domanda sull'argomento e prendo a riferimento l' "Inverse Fisher Transform applicato al RSI" (pagina 64, probacktest_c1504281788c.pdf). Ho fatto delle prove "daily" su EUR MXN ma i segnali (ingresso, uscita, long e short) sembrano che vengano ricalcolati a posteriori a seconda della data finale di simulazione. Non ho quindi dei segnali validi in tempo reale, tipo il sistema ZIG ZAG. Solo allontanandomi di qualche giorno dal segnale che appare sul grafico quest'ultimo si fissa su una data certa, quando ormai non serve più. Posso inviare un immagine se non sono stato chiaro. Grazie ancora della tua cortesia https://ibb.co/kcT8Xf

Great job and thanks very much for posting this @nicolas. I've backtested both these RSI and the RSX's 20 period, 20/80 cross overs/unders using the Kase Dev Stop as an Exit on the Daily £/Yen, FTSE and Dow (DJI) (between Aug. 2013 and Sept. 2018) and it appears that although the profits are less with the RSX (versus the RSI) it produces sensible drawdowns in the 25-30% range for the £/Yen and FTSE... but for some reason and despite using all the Dev Stops exits from 1 to 6 std deviations for the Dow, the Dow just isn't profitable. It's only ever profitable on the cross over of the mid line using Dev Stop 1.0 but that has a very high drawdown... which got me thinking about the probability of these bigger market moves as I noticed that your Ehler's Rocket RSI code: https://www.prorealcode.com/prorealtime-indicators/rocketrsi-john-ehlers had scaled/bounded the oscillator's output between +/-3 standard deviations. Can that be done here? If 3 std devs is -3/+3 = 0.999 then how would you denote a range output of between -6+6 std devs? I have looked at trying to modify this code here for the last hour without success, is it possible to do? This way gives us a different perspective to judge how large a specific market move has been and how likely and maybe it'll give me some insight as to why this indicator works well on the £/Yen and FTSE but not the Dow? Cheers Bard
Ok Grazie Nicolas.