







UNIVERSAL CHANNEL OSCILLATOR
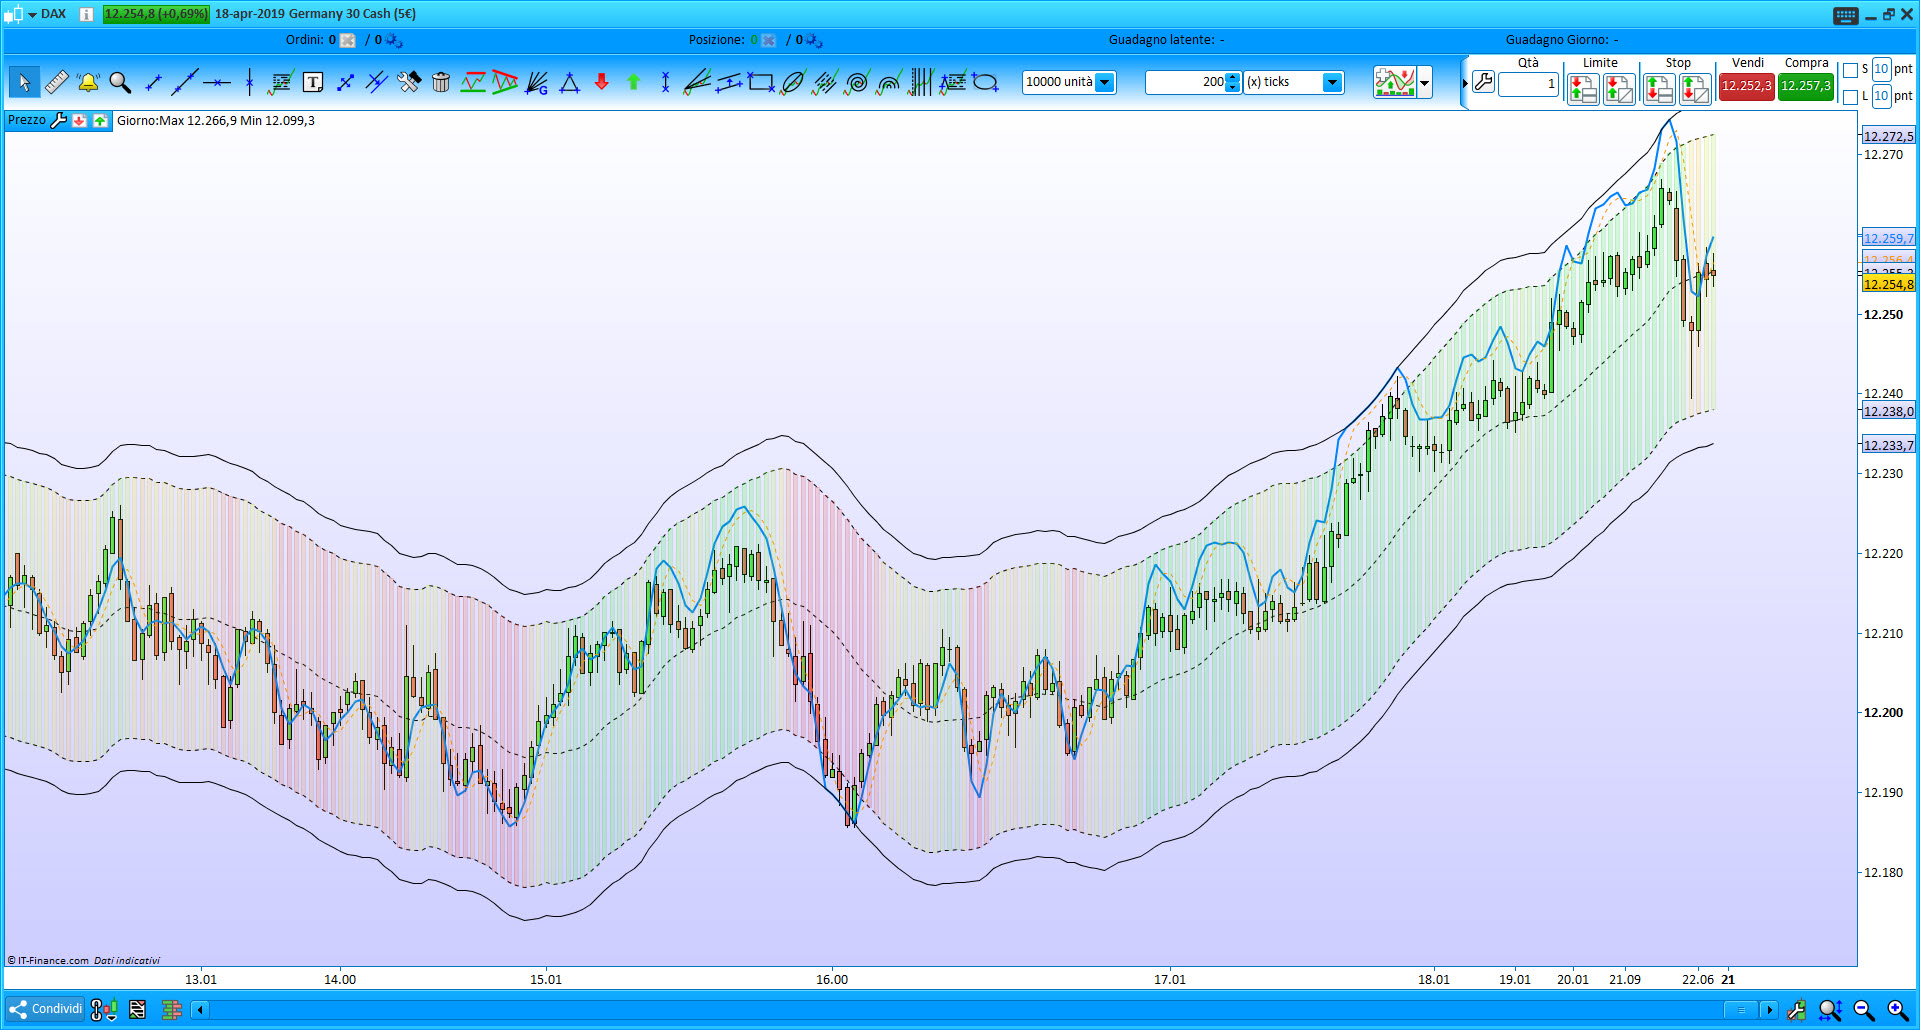
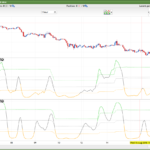
The Universal indicator by John Ehlers plotted directly on the chart, for an immediate understanding of its state. It has been implemented with the moving average of the oscillator, the overbought and oversold areas, and the colors indicating the direction of the trend. Suitable for any chart and time frame.
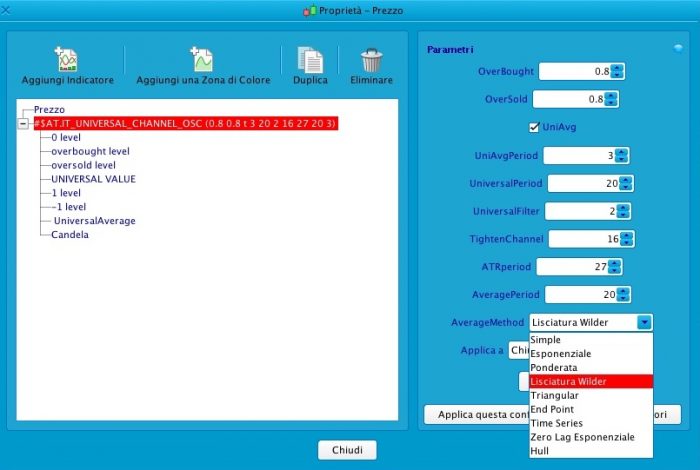
Indicator interface
- OVERBOUGHT = change the level of the Overbough line;
- OVERSOLD = change the level of the Oversold line;
- UNIAVG = enables or disables the moving average applied to the value of the Universal oscillator;
- UNIAVGPERIOD = changes the period of the moving average applied to the Universal oscillator;
- UNIVERSALPERIOD = changes the oscillator period;
- UNIVERSALFILTER = change the indicator filter period;
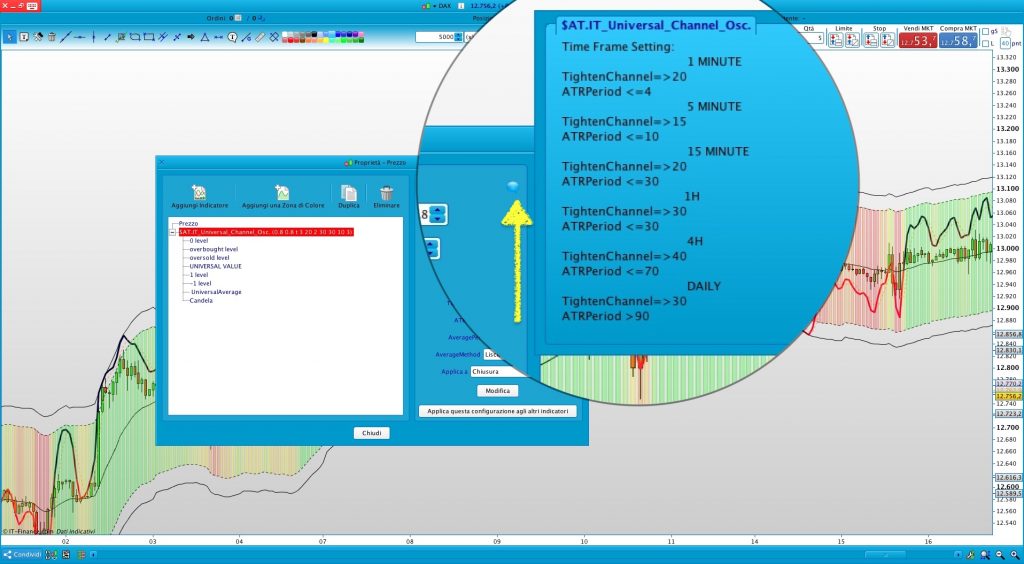
- TIGHTENCHANNEL = change the channel width;
- ATRPERIOD = changes the calculation period of the ATR used for the formation of the channel, serves to optimize the channel size;
- AVERAGEPERIOD = changes the value of the moving average used for the formation of the channel;
- AVERAGEMETHOD = is used to select the type of moving media used for the formation of the channel.
How it can be used:
- As a trend indicator;
- For inversion strategies;
- As a channel, to identify the range of market movement;
- As an entry and exit signal, when the Universal value crosses the level 0, or crosses the overbought and oversold levels, or its moving average;
- Within automatic trading strategies, such as entry, exit or as a filter.
//www.automatictrading.it
///////////////////////INDICATOR_UNIVERSAL
maPrice = customclose
bandedge= UniversalPeriod
whitenoise= (maPrice - maPrice[min(UniversalPeriod,UniversalFilter)])/2
if barindex>bandedge then
 a1= Exp(-1.414 * 3.14159 / bandedge)
 b1= 2*a1 * Cos(1.414*180 /bandedge)
 c2= b1
 c3= -a1 * a1
 c1= 1 - c2 - c3
 filt= c1 * (whitenoise + whitenoise[1])/2 + c2*filt[1] + c3*filt[1]

 filt1 = filt

 if ABS(filt1)>pk[1] then
  pk = ABS(filt1)
 else
  pk = 0.991 * pk[1]
 endif

 if pk=0 then
  denom = -1
 else
  denom = pk
 endif

 if denom = -1 then
  result = result[1]
 else
  result = filt1/pk
 endif
endif

///////////////////////////////////////////////////

dTR = 0
for i = 0to ATRperiod-1
 dTR=dTR+max(abs(Dhigh(i)-Dlow(i)),max(abs(Dhigh(i)-Dclose(i+1)),abs(Dlow(i)-Dclose(i+1))))
next
dtr=dtr/MAX(1,TightenChannel)
avgRange = dTR

maValue = average[max(1,AveragePeriod),AverageMethod](maPrice)

ResultValue = RESULT

Buffer1=maValue
Buffer2=maValue+(avgRange*((overBought)))
Buffer3=maValue-(avgRange*( (overSold)))
Buffer4=maValue+(ResultValue)/1*avgRange
Buffer5=maValue+(avgRange*((10/10)))
Buffer6=maValue+(avgRange*((-10/10)))


if UniAvg  then
 UniAvgline=Average[UniAvgPeriod](buffer4)
ELSE
 UniAvgline=UNDEFINED
endif

MyUNI = result
R = 50+(200-MyUNI*400)
G =50+(200+MyUNI*500)

DRAWCANDLE(Buffer2, Buffer3, Buffer2, Buffer3)coloured(R,G,0,40)

return Buffer1 coloured(0,0,0) style(dottedline,1) as "0 level", Buffer2 coloured(0,0,0) style(dottedline,1) as "overbought level", Buffer3 coloured(0,0,0) style(dottedline,1) as "oversold level", Buffer4 coloured(0,130,250) style(LINE,2) as "UNIVERSAL VALUE",Buffer5 AS"1 level",Buffer6 AS"-1 level",UniAvgline coloured(250,150,0) style(dottedline,1) AS" UniversalAverage"
Comments
You must be logged in to post a comment.

That's a great indicator and I especially the use of colors, more or less pronounced to indicate the power of the trend. Thank you for sharing this. NOTE: in new PRT v.11, it is better to use it on a window separated from the prices. Oops, I have to edit my post: even if not plotted on the price window, there are difficulties with using it on V.11: when you change the parameters (new average length, change of type of average, etc) nothing changes on the graph. Will you update the code, now that v.11 is available for IG clients? Thank you.






UniAvg
What is the Uniavg variable equal to?

Hi ALE, Thank you for the UNIVERSAL CHANNEL OSCILLATOR. Do you have an overview of which colour zones need to be added? When I add the indicator to the price I have by default only the 0 level as a dashed line. Thank you very much.
CORDIAL SALUDO. CUANDO REALIZO UN PROGRAMA CON ESTE INDICADOR ME SALE EL SIGUIENTE LETRERO : LA FUNCIÓN LLAMADA DESDE EL INDICADOR DEVUELVE 7 VALORES PERO SON 8. ME PUEDE AYUDAR POR FAVOR ?