







Support & Resistance Power Channel
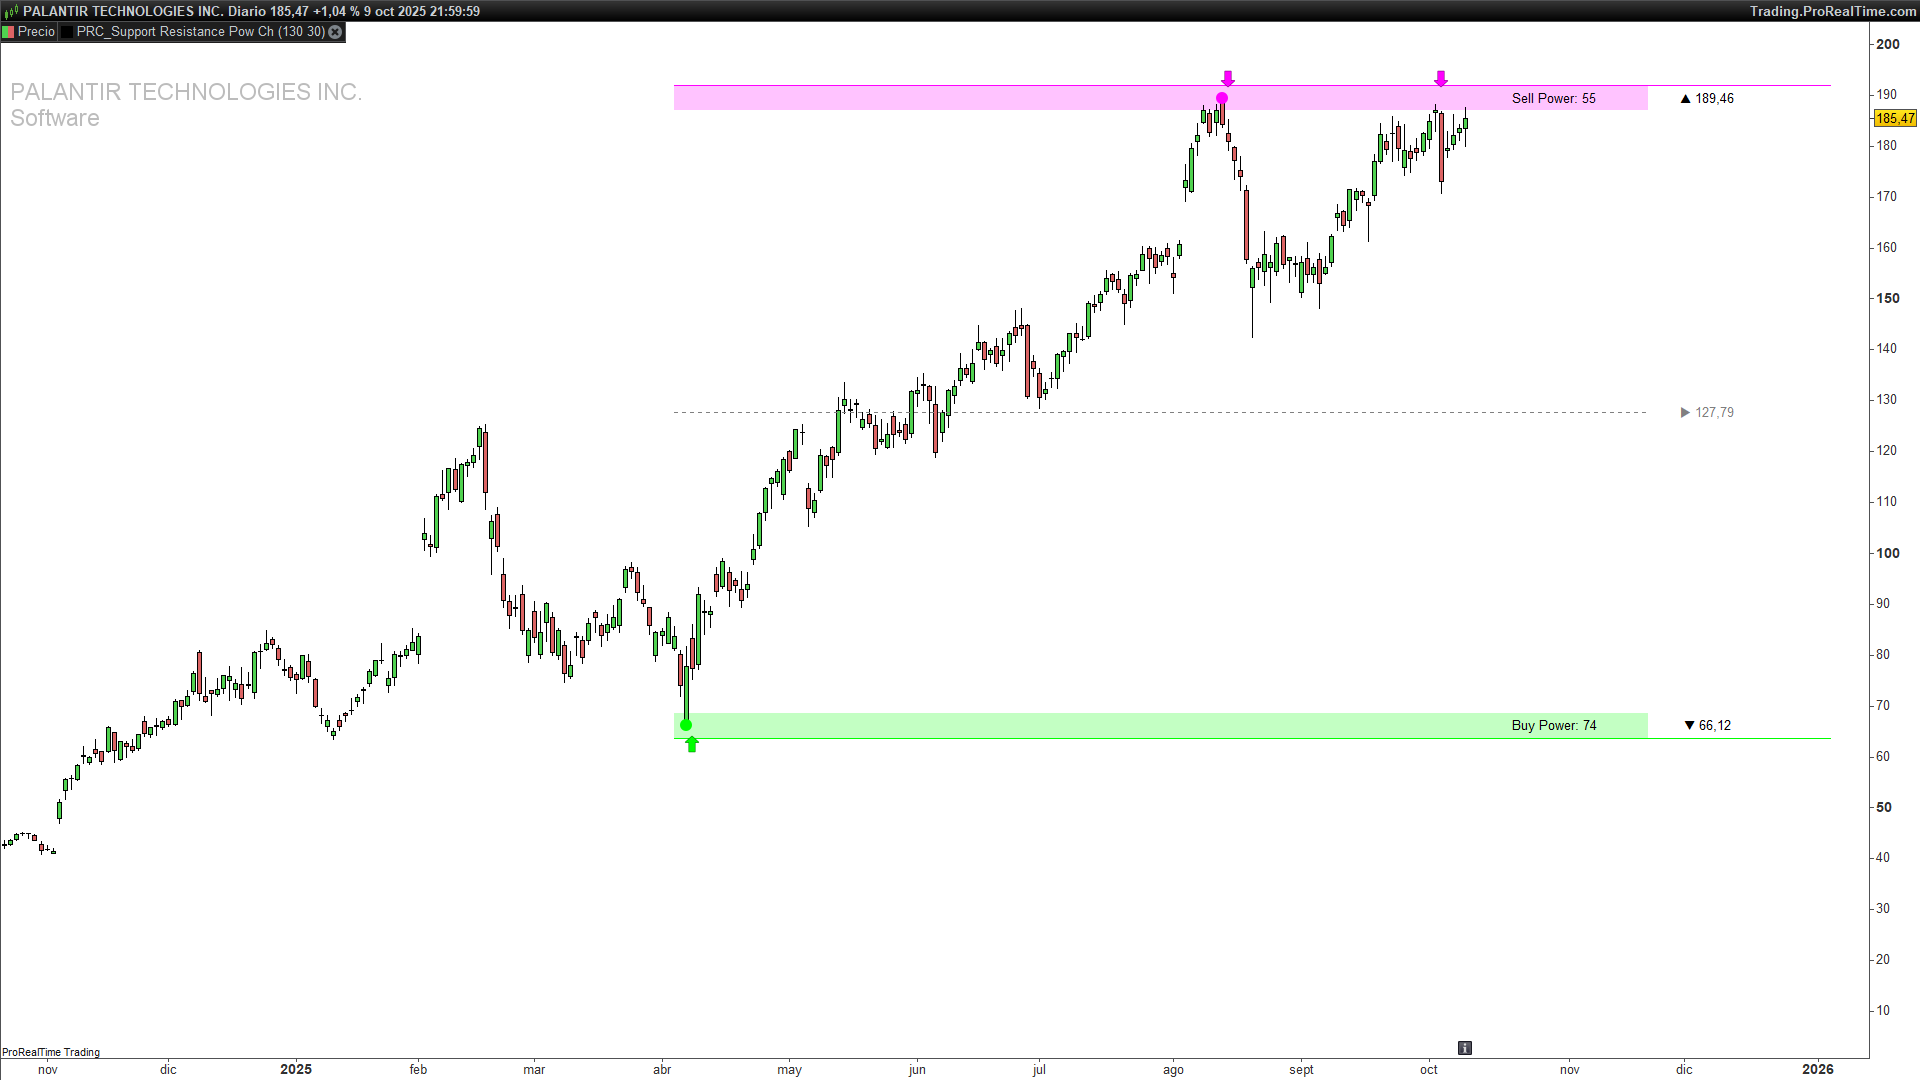
One-line summary:
A dynamic support/resistance channel that highlights recent extremes, projects actionable zones forward with ATR-based thickness, and quantifies “Buy vs. Sell Power” to gauge who’s in control.
1) What This Indicator Does
This tool builds a power channel using the highest high and lowest low over a configurable lookback. It then expands these bounds into support/resistance areas using a volatility buffer (ATR), plots a midline as a quick gravity center, and marks tests (touches/crosses) of the zones. On top of that, it tallies how many candles were bullish vs. bearish in the lookback window, displaying Buy Power and Sell Power as an ultra-fast market read.
At a glance, you get:
-
A resistance area around the recent highest high.
-
A support area around the recent lowest low.
-
A midline for mean-reversion context.
-
Arrows/points to call out zone tests and exact extremes.
-
Buy/Sell Power labels to judge recent pressure.
2) How It Works
a) Lookback highs & lows
The indicator computes:
-
maxVal= highest high overlength. -
minVal= lowest low overlength. -
midVal= (maxVal+minVal) / 2.
b) Volatility buffer (zone thickness)
It uses AverageTrueRange[200] * 0.5 to define half-ATR bands around the top and bottom levels. The result is a thickness that adapts to current volatility:
-
Resistance area spans
maxVal + ATR*0.5tomaxVal - ATR*0.5. -
Support area spans
minVal + ATR*0.5tominVal - ATR*0.5.
c) Forward projection
Zones are drawn from barindex - length (left anchor) to barindex + extend (right projection), so you see the channel ahead of current price action.
d) Buy vs. Sell Power
Over the last length candles, the script counts:
-
Buy Power: bars where
close > open. -
Sell Power: bars where
close < open.
Neutral candles (dojis) are ignored. Labels are placed near the support/resistance to keep context on the same vertical scale.
e) Zone tests & markers
-
A support test is flagged when price reclaims the top of the support band from below (low crosses above
topOfSupport), printing an up arrow under the zone. -
A resistance test is flagged when price rejects from the bottom of the resistance band (high crosses below
bottomOfResistance), printing a down arrow above the zone. -
Exact occurrences of the absolute high and absolute low in the window are point-marked for precision.
3) Inputs & Defaults
-
length(integer) — Lookback window for highs/lows and power count.-
Typical values: 100–200.
-
Example default:
length = 130.
-
-
extend(integer) — Forward projection (how far to extend drawings to the right).-
Typical values: 15–50 depending on chart timeframe.
-
Example default:
extend = 30.
-
-
Colors & opacity (RGBA)
-
Top zone (resistance):
tcolR=255, tcolG=0, tcolB=255(magenta tone) -
Bottom zone (support):
bcolR=0, bcolG=255, bcolB=0(green tone) -
Fill transparency:
alpha = 60(soft overlay)
Tweak to match your chart theme.
-
-
ATR factor (implicit):
AverageTrueRange[200] * 0.5-
You can change the ATR period (e.g., 100, 50) or the multiplier (e.g., 0.35 / 0.75 / 1.0) to tighten or loosen the zones.
-
4) Plot Elements & Visual Guide
-
Resistance area:
Rectangle + top guideline + “▲ #maxVal#” label at the right extension.
Useful to spot supply and potential exhaustion. -
Support area:
Rectangle + lower guideline + “▼ #minVal#” label.
Useful to spot demand and potential absorption. -
Midline (dotted):
Horizontal line at the midpoint betweenmaxValandminValwith a “▶ #midVal#” label.
Think of this as a balance point—helpful for mean-reversion bias. -
Tests:
-
Up arrows appear when price reclaims the top of support from below.
-
Down arrows appear when price rejects the bottom of resistance from above.
-
Points mark the exact bar(s) that set the window’s absolute high/low.
-
-
Buy/Sell Power labels:
Plotted to the right of price (halfway into the extension), aligned with the top/bottom zones for instant context.
5) How to Use It in Practice
A) Bounce mindset (range conditions)
-
Prefer longs near support area when tests fire upward (up arrows) and Buy Power ≥ Sell Power.
-
Prefer shorts near resistance area when tests fire downward (down arrows) and Sell Power ≥ Buy Power.
B) Breakout mindset (trend conditions)
-
A strong close beyond the resistance area with rising Buy Power tilts bias to continuation.
-
A decisive close below the support area with rising Sell Power favors continuation down.
C) Midline behavior
-
In choppy markets, price frequently gravitates to the midline after an extreme; watch for reversion trades back to midline when tests appear at the band edges.
-
In strong trends, the midline often flips from magnet to support/resistance. Treat touches as continuation opportunities if power counts agree.
D) Multi-timeframe tips
-
Use a higher timeframe channel for regime and key levels, then execute on a lower timeframe when tests or breakouts align with the bigger picture.
Nothing here is financial advice; this is a visual decision aid. Always test and manage risk.
6) Parameter Tuning & Examples
-
Increase
lengthfor smoother, more stable zones (great for higher timeframes or swing bias). -
Decrease
lengthfor reactive zones (scalping/intraday), at the cost of more frequent changes. -
Increase
extendwhen you want the levels to stay visible further into the right margin (handy for planning). -
Decrease
extendto declutter on smaller screens or lower timeframes. -
ATR period & factor
-
Shorter ATR or larger multiplier → thicker zones (more tolerance, fewer false tests).
-
Longer ATR or smaller multiplier → thinner zones (tighter precision, more tests).
-
-
Color & opacity
-
Keep high contrast but avoid fully opaque fills; the default
alpha=60is a good balance.
-
7) Trade Ideas & Rules of Thumb (Non-Financial Advice)
-
Conservative bounce
-
Wait for an up arrow at support (or down arrow at resistance), then a confirming candle in your direction.
-
Stops just outside the zone (e.g., beyond 1× to 1.5× the ATR buffer).
-
Consider partial profits near midline, trail remainder toward the opposite band.
-
-
Aggressive breakout
-
Enter on a close beyond a band with power count in favor (Buy>Sell for upside, vice versa for downside).
-
Invalidations: return into the zone or power count flipping the other way.
-
Trail using recent swing structure or a multiple of ATR.
-
-
Midline mean-reversion
-
If range-bound and power is balanced, look for fades from band → midline and midline → opposite band.
-
8) Limitations & Best Practices
-
Trending vs. ranging: Bounces are less reliable in strong trends; consider breakouts + pullbacks instead.
-
Late recognition: A very large
lengthmakes zones stable but slower to reflect regime shifts. -
Noise: Ultra-short settings may cause over-signaling; pair with structure (swings/volume) to filter.
-
Clarity: If the chart feels busy, reduce
extend, lighten fills, or hide midline until needed.
9) ProBuilder Code
// -----------------------------------------------
// PRC_Support and Resistance Power Channel [ChartPrime]
//version = 0
//07.10.2025
//Iván González @ www.prorealcode.com
//Sharing ProRealTime knowledge
// -----------------------------------------------
// INPUTS
// -----------------------------------------------
DEFPARAM DRAWONLASTBARONLY = true
length = 130
extend = 30
// COLOURS
tcolR = 255
tcolG = 0
tcolB = 255
bcolR = 0
bcolG = 255
bcolB = 0
alpha = 60
// -----------------------------------------------
// CALCULATION SUPPORT AND RESISTANCE AREA
// -----------------------------------------------
// ATR
atr = AverageTrueRange[200] * 0.5
// HIGHEST AND LOWEST PRICE
maxVal = HIGHEST[length](high)
minVal = LOWEST[length](low)
midVal = (maxVal + minVal) / 2
// -----------------------------------------------
// DRAW SUPPORT AND RESISTANCE AREA
// -----------------------------------------------
if islastbarupdate then
maxOffset = barssince(high=maxVal)
minOffset = barssince(low=minVal)
// RESISTANCE AREA
DRAWRECTANGLE(barindex - length, maxVal + atr, barindex + extend, maxVal - atr) fillcolor(tcolR, tcolG, tcolB, alpha)COLOURED(tcolR, tcolG, tcolB,0)
DRAWSEGMENT(barindex - length, maxVal + atr, barindex + extend + 30, maxVal + atr) COLOURED(tcolR, tcolG, tcolB)
DRAWTEXT("▲ #maxVal#", barindex + extend + 10, maxVal)

// SUPPORT AREA
DRAWRECTANGLE(barindex - length, minVal + atr, barindex + extend, minVal - atr) fillcolor(bcolR, bcolG, bcolB, alpha)COLOURED(bcolR, bcolG, bcolB, 0)
DRAWSEGMENT(barindex - length, minVal - atr, barindex + extend + 30, minVal - atr) COLOURED(bcolR, bcolG, bcolB)
DRAWTEXT("▼ #minVal#", barindex + extend + 10, minVal)

// MIDDLE LINE
DRAWSEGMENT(barindex - length, midVal, barindex + extend, midVal) COLOURED(128, 128, 128) STYLE(DOTTEDLINE, 1)
DRAWTEXT("▶ #midVal#", barindex + extend + 10, midVal) COLOURED(128, 128, 128)

// BUY AND SELL POWER
buyPower = 0
sellPower = 0

FOR i = 0 TO length - 1 DO
IF close[i] > open[i] THEN
buyPower = buyPower + 1
ELSIF close[i] < open[i] THEN
sellPower = sellPower + 1
ENDIF
NEXT

textPosX = barindex + round(extend*0.5)
DRAWTEXT("Sell Power: #sellpower#", textPosX, maxVal)
DRAWTEXT("Buy Power: #buypower#", textPosX, minVal)

// DRAW SUPPORT AND RESISTANCE TESTS
topOfSupport = minVal + atr
bottomOfResistance = maxVal - atr

FOR i = 0 TO length - 1 DO
IF low[i+1] <= topOfSupport AND low[i] > topOfSupport THEN
DRAWARROWUP(barindex - i, minval - atr*1.5) COLOURED(bcolR, bcolG, bcolB)
ENDIF
IF high[i+1] >= bottomOfResistance AND high[i] < bottomOfResistance THEN
DRAWARROWDOWN(barindex - i, maxval + 1.5*atr) COLOURED(tcolR, tcolG, tcolB)
ENDIF
if high[i]=maxval then
drawpoint(barindex[i],maxval,3)coloured(tcolR, tcolG, tcolB)
endif
if low[i]=minval then
drawpoint(barindex[i],minval,3)coloured(bcolR, bcolG, bcolB)
endif
NEXT

endif

return
Comments
You must be logged in to post a comment.

Che cosa sono quei numeri a destra di Sell power e Buy power?

Hello Ivan, is it possible have the bot related to this indicator? Thank you in andvance!!!
You would have to enter the buy instructions, but I don’t think you’ll get good results without doing anything else. if not onmarket and low[1]<=topOfSupport and low>topOfSupport then buy 1 contract at market endif if not onmarket and high[1]>=bottomOfResistance and high>bottomOfResistance then sellshort 1 contract at market endif
Thank a lot Ivan! Is it possible have a bot that enter on the arrow?

Hello Ivan is it possible to have an histogram version giving +1 when you have a green arrow and -1 when you have a magenta arrow. The idea is to be able to create an alert in real time on each arrow. Thanks for you help