Deviation-Scaled Moving Average – DSMA

Deviation-Scaled Moving Average – DSMA

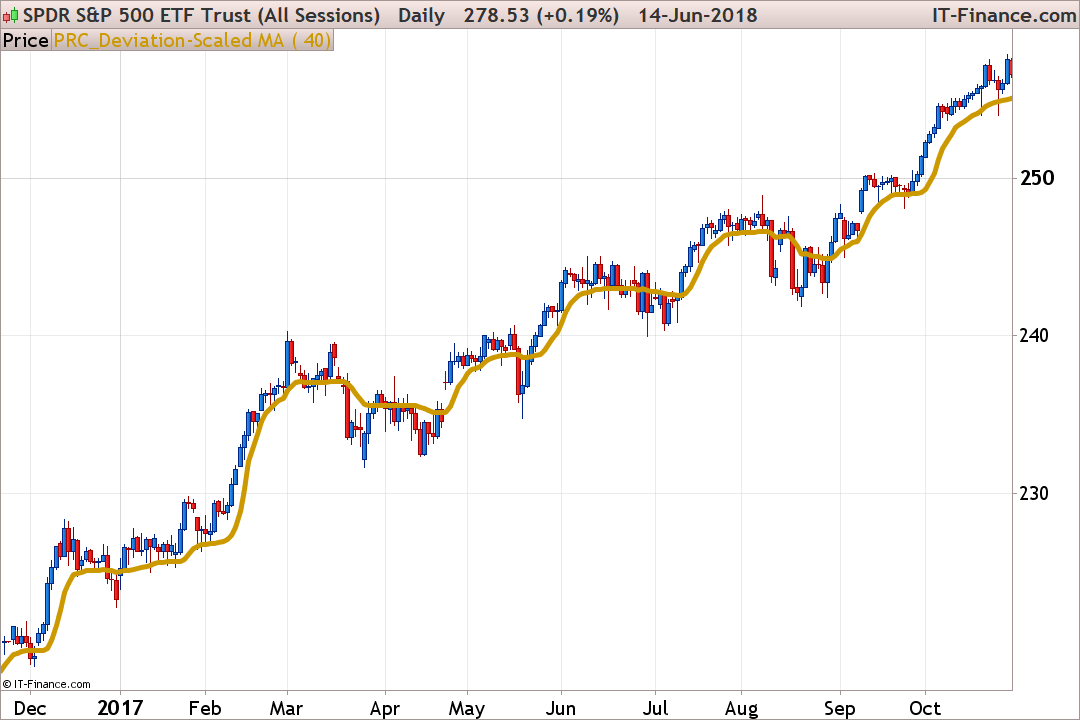
Here is the new DSMA moving average made my John Ehlers and featured in the July 2018 issue of TASC magazine.

The DSMA is an adaptive moving average that features rapid adaptation to volatility in price movement.
It accomplishes this adaptation by modifying the alpha term of an EMA byt he amplitude of an oscillator scaled in standard deviations from the mean. The DSMA’s responsiveness can be changed by using different values for the input parameter period.

John Ehlers


Share this

Risk disclosure:

No information on this site is investment advice or a solicitation to buy or sell any financial instrument. Past performance is not indicative of future results. Trading may expose you to risk of loss greater than your deposits and is only suitable for experienced investors who have sufficient financial means to bear such risk.

ProRealTime ITF files and other attachments : How to import ITF files into ProRealTime platform?

PRC is also on YouTube, subscribe to our channel for exclusive content and tutorials

  1. juanj • 06/15/2018 #

    @Nicolas, what would be the code if I want to use this as a Band calculated using true exponential deviation bands;

    https://www.prorealcode.com/prorealtime-indicators/exponential-volatility-bands/

    I have tried combining them already but my math skills fail me

    • Nicolas • 06/15/2018 #

      You only have to replace the “EWMA” calculation from this indicator with the DSMA variable made in this one. Please let me know if you have still trouble making this.

    • juanj • 06/15/2018 #

      That was actually the first thing I tried, but the result didn’t look right to me. So I started experimenting with replacing some variables of the EWMA (i.e. Dev, alpha) band with those of the DSMA (i.e. RMA, alpha1). Produces interesting results but unsure of their correctness.

  2. JohnScher • 06/15/2018 #

    Hello, Nicolas.

    Nice work from you! Thank you very much. Really!

    Is there a strategy that can be derived from this? e.g. buying at crosses over selling at crosses under the yellow line? Are there any results for such a strategy – possibly in combination with other strategies?
    cause
    I think it’s just another average more on the tableau. What can he do more than other averages? Has Ehlers tested that? Are there any results? Published?

    I’m sorry, the criticism, sometimes I’m just tired of “always the same thing”.

    Friendly greetings

  3. juanj • 06/15/2018 #

    @JohnScher, with regards to your question of can a strategy be derived from this, that is an open-ended question.
    Obviously, a strategy can be derived from this as with anything else?!

    And with regards to is this just another MA, yes it is. And just like any other MA it has it’s place among all the others SMA, EMA, Wilders, DEMA, ZEMA, etc.
    Perhaps you can read the article in TASC, where the merits of the indicator is explained?

    I personally use and experiment with all different kinds of indicators and methods to create strategies.

    I love concepts such as ‘zero lag’ indicators or exponentially calculated Bollinger Bands or in this case std deviation calculated MA’s!

    I am actually planning to use this to create deviation scaled exponentially calculated bollinger band.

  4. Domenec • 06/15/2018 #

    No esta mal yo utilizo la ema 8 y la wilder8 y la banda que generan con muy buenos resultados sin embargo le he visto algun detalle interesante a esta nueva media me la estudiare con cariño y ya comentare los resultados

  5. Appsoluxions • 06/15/2018 #

    Hi Nicolas, do you have the MT4 version of the indicator? I am not sure if these kind of questions are welcome, if not appologies in advance. Thank you.

    • Nicolas • 06/15/2018 #

      Hi, don’t have one sorry. But you can still ask for private coding through our programming services: https://www.prorealcode.com/trading-programming-services/

  6. Appsoluxions • 06/15/2018 #

    Cool. Thanks for the response.

avatar
Register or

Likes

avatar avatar avatar avatar avatar avatar avatar avatar avatar
Related users ' posts
Iván
1 month ago
cjr30 Simplemente modifica las lineas 19 y 21 por las siguientes: drawtext("▲",barindex,low-0.1*a...
groelandes Gracias!!
WhyAskOZ i copied the code into strategy and it gives error on line 21 and 23. it says " Line 1: ...
jacquesgermain Bonjour non pas de soucis car src=customclose donc dans le menu configuration/propriété me...
geroniman Merci Jacques , indic tres utile. J'ai un indic à programmer avec du price action. es tu dis...
jacquesgermain ok pour regarder ...
Nicolas
11 months ago
f1_maik Ein sehr schöner Indikator, vielen Dank. Wenn ich den Indikator importiere und starte hat d...
Nicolas das ist in der Tat normal, Sie müssen die Auf- und Abwärtsfarbe direkt im Parameterfenster d...
FXtonio Bonjour Nicolas, merci pour cette merveille, je l'utilise en compl2ment du "magical buy sell...
supertiti Bel outil si on ne se tape pas sur les doigts avec ! Comment ajoute-on une image avec le co...
magnus59 Hi Nicolas, thaks for your great work here, I need a scanner for the swedish OMX when ma...
Nicolas Yes, sure please open a new topic in the ProScreener forum section, thank you.
paullyons Hello! Thanks for post your indicators. I'd like you to let me know how to draw lines for ...
Rafa Hi Nicolas! I can´t install this indicator. it installs in a separate window not as an av...
Nicolas Add it on the price, see how: https://www.prorealcode.com/blog/video-tutorials/how-to-add-an...
Frankyslo1 No consigo instalarlo en el precio en PRL-version 10
Madrosat how do you use carnazzi filter in a strategy : smoothing , stop ,tendance
Bruno Carnazzi I have completely revised the mathematical foundations of this tool and offer you the finali...
Bruno Carnazzi Il me semble que la fonction "floor" n'est disponible qu'avec PRT11, à vérifier
DELBERT Bonjour , merci pour votre réponse , je m'excuse je suis avec PRT v10.3 donc c'est indicateu...
Nicolas c'est juste, c'est une instruction très récente.
ChemaGeek Bonjour Nicolas, j'ai récemment découvert cet indicateur (Regularized Momentum 2017) et je l...
YvesRobert Bonjour, nouveau sur PRT (qq jours), j'essaie un peu de voir quel type d'indicateur me convi...
RubberToe Is there something we are missing here, I just get the same curved line as well...
Khaled @Nicolas, Hi Nicolas, I've downloaded the itf and it doesn't display as an Oscillator, it"s ...
sal157011 I think the problem here is that you must feed the trigonometric functions cos and sin with ...
Roland57800 Bonjour Noobywan, si je comprends bien l'utilisation de ce code que je trouve particulièr...
Noobywan Bonjour, quand la question a été posée dans le forum à celui qui avait fait la requête en am...
Fabian This Code draws only a retangle if the condition has been confirmed and NOT before (in that ...
RakeshPoluri I have a question about the bands on the candles. Is it bollinger bands or something else?
Nicolas I think that's 2 Bollinger Bands
Emperor.it "style(line,2)" C'è una guida ai parametri che si possono modificare ? Tipo stile della lin...
IV Mcm https://www.prorealcode.com/programming-with-prorealtime/
fazel53 How do i attach this indicator to my mt5 platform?
Nicolas You can't! All indicators here are for ProRealTime trading platform: https://www.prorealtime...
Nicolas c'est exactement ce que je fais entre les lignes 58 et 64 pour pouvoir tracer la ligne complète
Italo Fabian Nicolas, Ces matrices sont-elles des vecteurs unidimensionnels ou multidimensionnels? Depu...
Denis Bonjour Nicolas et RicLg, Merci Nicolas pour cet indicateur intéressant et merci RicLg pour...

Top