1. Introduction
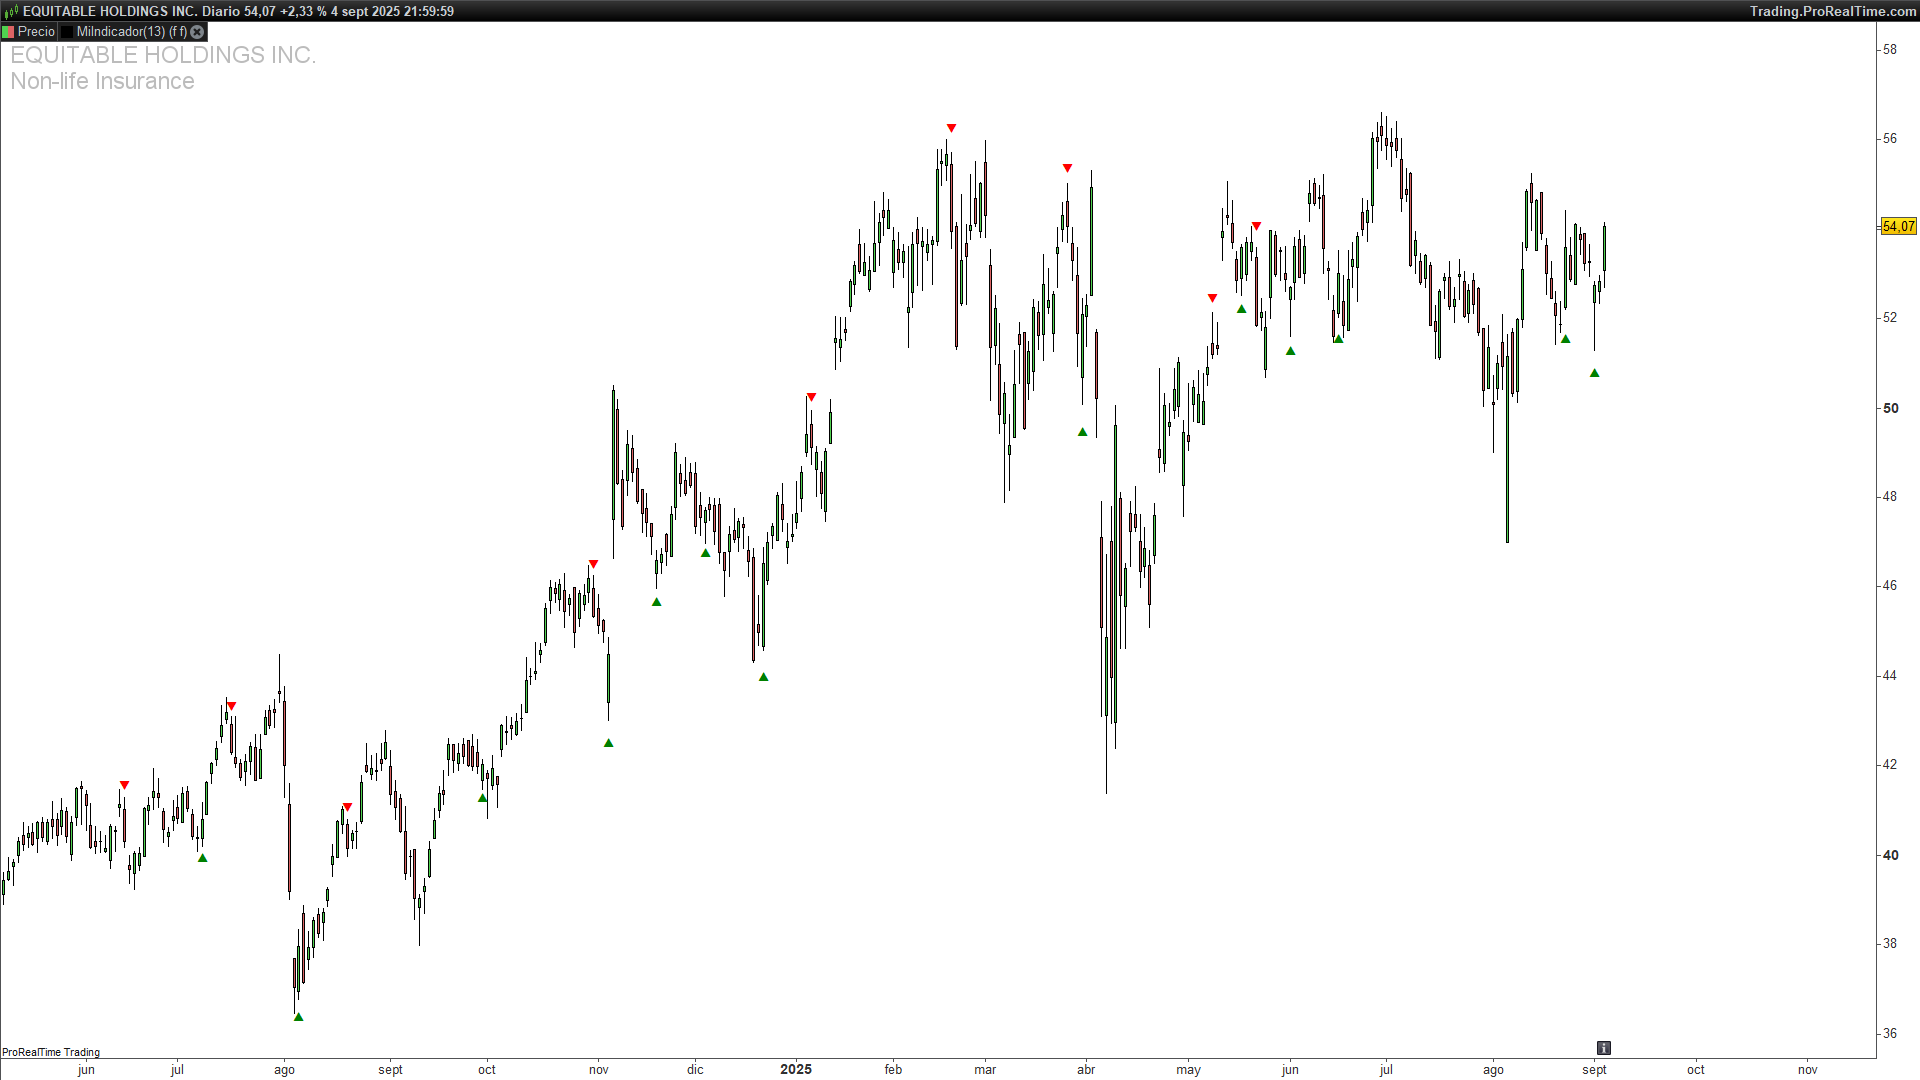
The 3 Line Strike (3LS) pattern is a price action formation rooted in Japanese candlestick analysis. It is a relatively rare but powerful reversal signal, indicating a potential change in trend following a strong price sequence.
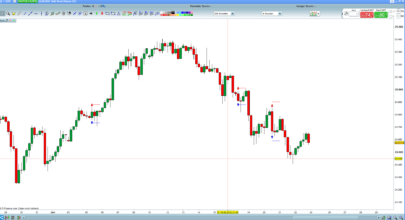
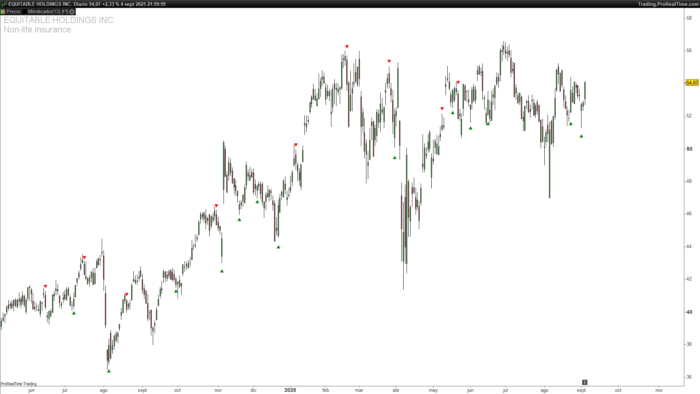
This indicator automatically detects such setups in real-time and highlights them directly on the chart, removing the need for manual identification.
2. How the Indicator Works
The indicator by TheTrdFloor combines two well-known candlestick concepts:
🔹 Bullish and Bearish Engulfing:
-
Bearish Engulfing: A green (bullish) candle followed by a larger red (bearish) candle.
-
Bullish Engulfing: A red (bearish) candle followed by a larger green (bullish) candle.
🔹 3 Line Strike (3LS) pattern:
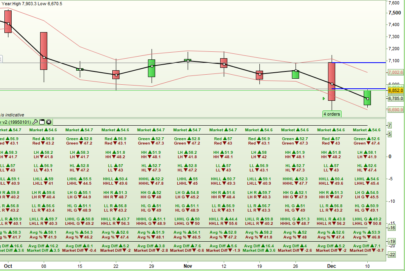
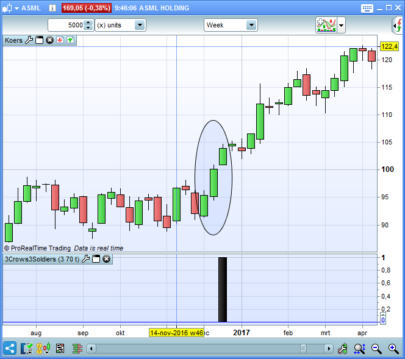
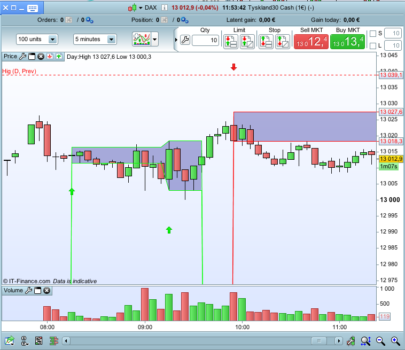
This pattern requires a sequence of 3 consecutive candles in the same direction, immediately followed by a larger engulfing candle in the opposite direction, signaling a reversal.
Bearish 3 Line Strike (Sell Signal):
-
Three consecutive bullish (green) candles.
-
Followed by a larger bearish (red) engulfing candle.
-
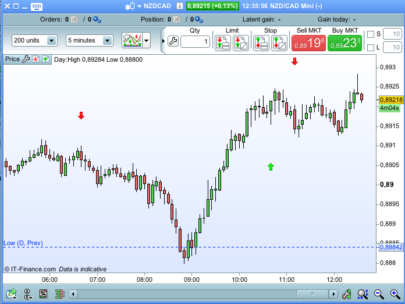
A red downward arrow (
▼) is drawn above the signal bar.
Bullish 3 Line Strike (Buy Signal):
-
Three consecutive bearish (red) candles.
-
Followed by a larger bullish (green) engulfing candle.
-
A green upward arrow (
▲) is drawn below the signal bar.
The indicator also optionally displays simple engulfing candles using smaller symbols (⌃ and ⌄), which can be enabled or disabled via parameters.
3. Indicator Settings
You can control whether simple bullish or bearish engulfing candles are displayed with the following input parameters:
-
showBullEngulfing: Set to1to show bullish engulfing candles (⌃), or0to hide them. -
showBearEngulfing: Set to1to show bearish engulfing candles (⌄), or0to hide them.
This allows you to focus solely on 3LS signals if desired.
4. Practical Applications
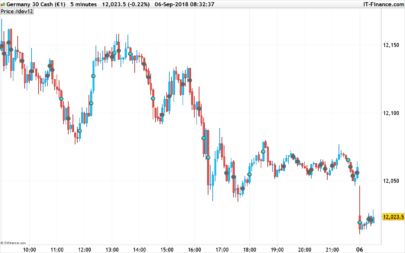
This indicator works well on any timeframe, but it is generally more reliable on daily charts or higher, where candlestick formations carry more weight.
✅ Advantages:
-
Automatically detects powerful reversal patterns.
-
Provides clear visual cues directly on the chart.
-
Easily integrates with price action-based strategies.
⚠️ Limitations:
-
Not all signals are reliable; it’s recommended to use additional filters (like RSI, moving averages, or volume).
-
May produce premature signals in volatile or sideways markets.
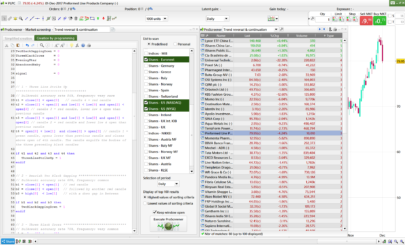
5. ProRealTime Code
|
1 2 3 4 5 6 7 8 9 10 11 12 13 14 15 16 17 18 19 20 21 22 23 24 25 26 27 28 29 30 31 32 33 34 35 36 37 38 39 40 41 42 43 44 45 46 47 48 49 50 51 52 53 54 55 56 57 58 59 60 61 62 |
//---------------------------------------------------------------------// //PRC_3 Line Strike by TheTrdFloor //version = 0 //09.04.24 //Iván González @ www.prorealcode.com //Sharing ProRealTime knowledge //---------------------------------------------------------------------// //-----Inputs----------------------------------------------------------// showBullEngulfing=0 showBearEngulfing=0 //---------------------------------------------------------------------// //-----Candle Color // -1 -> Red/Bearish // 0 -> Doji // +1 -> Green/BUllish if close>open then ret=1 elsif close<open then ret=-1 else ret=0 endif //---------------------------------------------------------------------// //-----Check for engulfing candles-------------------------------------// sizePrevCandle=close[1]-open[1] sizeCurrentCandle=close-open isCurrentLargerThanPrevious=abs(sizeCurrentCandle)>abs(sizePrevCandle) //---------------------------------------------------------------------// //-----Check for bearish engulfing-------------------------------------// //(green candle followed by a larger red candle) isGreenToRed=(ret<0 and ret[1]>0) checkBearish=isGreenToRed and isCurrentLargerThanPrevious //-----Check for bullish engulfing-------------------------------------// //(red candle followed by a larger green candle) isRedToGreen=(ret>0 and ret[1]<0) checkBullish=isRedToGreen and isCurrentLargerThanPrevious //---------------------------------------------------------------------// //-----Check for Bearish 3LS-------------------------------------------// //3 green candles immediately followed by a bearish engulfing candle is3LineSetupGreen = ret[1]>0 and ret[2]>0 and ret[3]>0 is3LSBear=is3LineSetupGreen and checkBearish //---------------------------------------------------------------------// //-----Check for Bullish 3LS-------------------------------------------// //3 red candles immediately followed by a bullish engulfing candle is3LineSetupRed=ret[1]<0 and ret[2]<0 and ret[3]<0 is3LSBull=is3LineSetupRed and checkBullish //---------------------------------------------------------------------// //-----Plots for the 3LS signal----------------------------------------// if is3LSBull then drawtext("▲",barindex,low-0.25*tr)coloured("green") elsif is3LSBear then drawtext("▼",barindex,high+0.25*tr)coloured("red") endif //---------------------------------------------------------------------// //-----Plots Bullish/Bearish engulfing---------------------------------// if showBullEngulfing and checkBullish and not is3LSBull then drawtext("⌃",barindex,low-0.25*tr)coloured("green") elsif showBearEngulfing and checkBearish and not is3LSBear then drawtext("⌄",barindex,high+0.25*tr)coloured("red") endif //---------------------------------------------------------------------// return |
Share this
No information on this site is investment advice or a solicitation to buy or sell any financial instrument. Past performance is not indicative of future results. Trading may expose you to risk of loss greater than your deposits and is only suitable for experienced investors who have sufficient financial means to bear such risk.
ProRealTime ITF files and other attachments :
Find other exclusive trading pro-tools on ![]()
PRC is also on YouTube, subscribe to our channel for exclusive content and tutorials