







ZigZag and SR: Dynamic Swing Analysis with Support and Resistance
1) Introduction
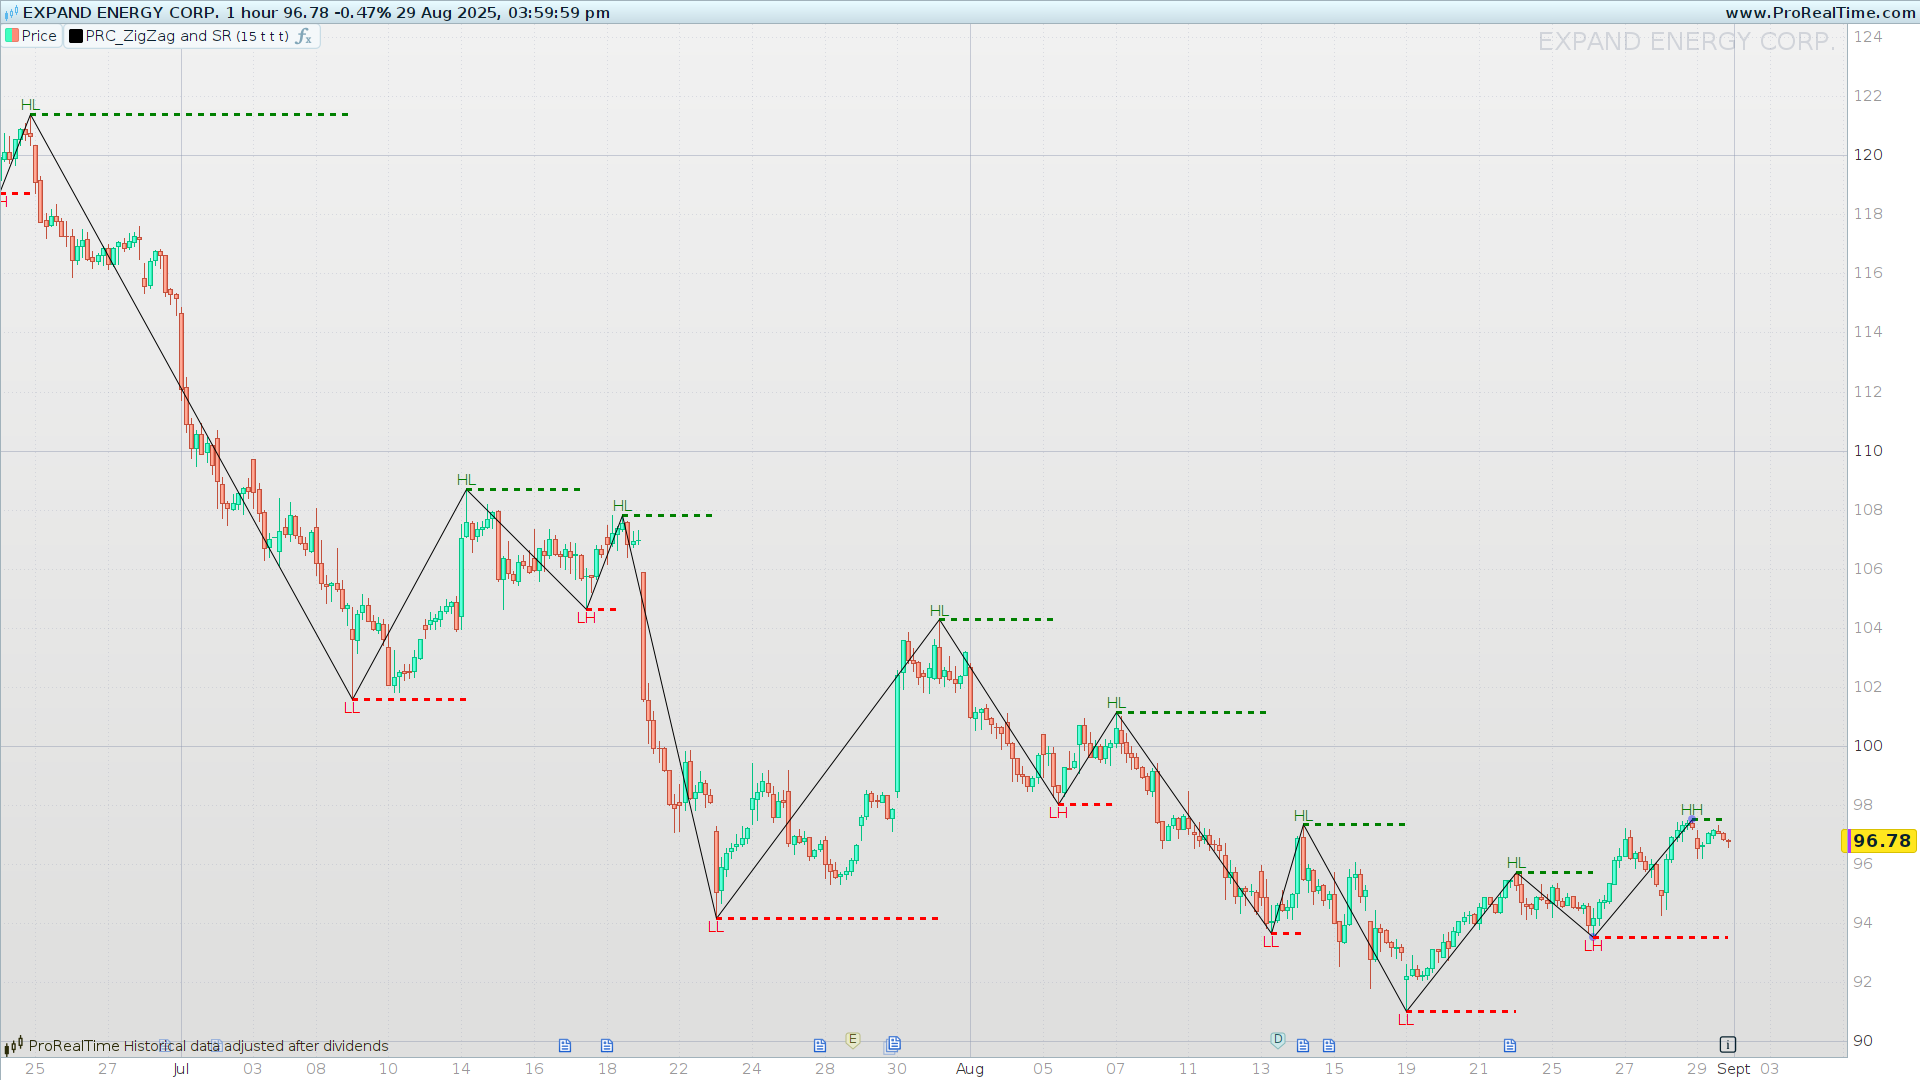
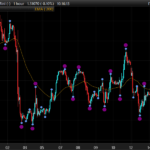
The ZigZag indicator is a classic tool to filter out minor price fluctuations and highlight major swing points. The version presented here, ZigZag and SR, goes one step further by combining the swing structure with automatic support and resistance levels, as well as labels for trend classification.
This makes it particularly useful for traders who want a clean, structural view of price action without being distracted by noise.
2) What does “ZigZag and SR” add?
While a standard ZigZag only connects pivot highs and lows, this enhanced version introduces:
- Dynamic support and resistance levels (green/red dotted lines).
- Automatic trend labeling: Higher High (HH), Higher Low (HL), Lower High (LH), Lower Low (LL).
- Customizable visualization: the user can enable or disable the ZigZag lines, support/resistance, and labels.
- ATR-based positioning of labels to avoid overlap with price bars.
These features provide an intuitive chart overlay that helps traders quickly assess trend direction and key zones of interest.
3) How it works (step by step)
a) Pivot detection
The algorithm scans for pivot highs (highest[prd](high)) and pivot lows (lowest[prd](low)) over a user-defined lookback period (prd).
b) Direction of movement
Once a pivot is identified, the indicator determines the direction of the swing:
- Uptrend segment (
dir = 1) when a pivot high is confirmed. - Downtrend segment (
dir = -1) when a pivot low is confirmed.
A variable tracks changes of direction (dirchanged) to ensure the ZigZag only updates when a genuine swing reversal occurs.
c) ZigZag construction with arrays
Arrays ($zigzag, $zigzagidx, $dir) are used to store pivot levels, their bar indices, and direction.
When a new pivot is confirmed:
- If the trend has changed, a new segment is added.
- If the trend continues, the last segment is updated to extend to the new extreme.
This ensures the indicator always reflects the most relevant market swings.
d) Dynamic support and resistance
For every confirmed pivot, the indicator projects horizontal dotted lines forward in time:
- Green for support (pivot low).
- Red for resistance (pivot high).
These lines dynamically extend until a new structure point invalidates them.
e) HH, HL, LH, LL classification
Based on the relative position of new pivots compared to previous ones, the code labels swings as:
- HH (Higher High) or HL (Higher Low) in uptrends.
- LH (Lower High) or LL (Lower Low) in downtrends.
To avoid clutter, labels are shifted up or down using ATR(14) as a margin.
f) Efficient rendering with islastbarupdate
To optimize performance, the drawing routines are executed only when the last bar updates, preventing unnecessary redrawing across all candles.
4) Parameters and recommended settings
prd(default = 15): Defines the sensitivity of pivot detection.- Higher values → fewer swings, only major moves.
- Lower values → more swings, captures smaller fluctuations.
showSR(default = 1): Enables or disables the support/resistance dotted lines.showLabels(default = 1): Toggles the HH/HL/LH/LL labels.showZZ(default = 1): Toggles the ZigZag connecting lines.
These options give full flexibility: the user can display only the ZigZag, only support/resistance, or the complete setup.
5) Reading the chart: practical cases
- Trending markets: The sequence of HH-HL or LL-LH clearly shows the dominant direction. Support and resistance levels confirm continuation or possible breakout points.
- Range-bound markets: The ZigZag alternates between highs and lows of similar magnitude, highlighting horizontal zones of equilibrium.
- Breakouts: When a support or resistance dotted line is breached, traders can quickly spot the transition to a new structural phase.
This makes the tool adaptable for both trend-following strategies and mean-reversion setups.
6) Limitations and best practices
- Repainting nature: As with all ZigZag indicators, the latest swing may repaint until a pivot is fully confirmed. This is not a bug but a characteristic of ZigZag logic.
- Choosing
prdwisely:- Use larger values on higher timeframes to capture meaningful structure.
- Use smaller values on intraday charts for short-term swing recognition.
- Timeframe sensitivity: The indicator adapts to any timeframe but behaves best when aligned with your trading horizon.
By understanding these nuances, traders can avoid common pitfalls and integrate the tool effectively into their workflow.
7) Code
//------------------------------------//
//PRC_ZigZag and SR
//version = 0
//03.12.2024
//Iván González @ www.prorealcode.com
//Sharing ProRealTime knowledge
//------------------------------------//
// Inputs
//------------------------------------//
prd=15
showSR=1 //Show Support and Resistance//Boolean// 0 means false 1 means True
showLabels=1 //Boolean// 0 means false 1 means True
showZZ=1 //Boolean// 0 means false 1 means True
atr=averagetruerange[14](close)
//------------------------------------//
// Calculate Pivot High and Low
//------------------------------------//
ph = high=highest[prd](high)
pl = low=lowest[prd](low)
//------------------------------------//
// Calculate Direction
//------------------------------------//
if ph and pl=0 then
   dir=1
elsif pl and ph=0 then
   dir=-1
else
   dir=dir
endif
dirchanged=dir<>dir[1]
//------------------------------------//
// Calculate ZizZag levels and x
//------------------------------------//
if ph or pl then
   if dirchanged then
      if dir=1 then
         $zigzag[t+1]=highest[prd](high)
         $zigzagidx[t+1]=barindex
         $dir[t+1]=1
         t=t+1
      elsif dir=-1 then
         $zigzag[t+1]=lowest[prd](low)
         $zigzagidx[t+1]=barindex
         $dir[t+1]=-1
         t=t+1
      endif
   else
      if dir=1 and highest[prd](high)> $zigzag[t] then
         $zigzag[t]=highest[prd](high)
         $zigzagidx[t]=barindex
      elsif dir=-1 and lowest[prd](low)< $zigzag[t] then
         $zigzag[t]=lowest[prd](low)
         $zigzagidx[t]=barindex
      endif
   endif
endif
//------------------------------------//
// Draw ZigZag and Levels
//------------------------------------//
$zigzag[0]=undefined
$zigzagidx[0]=undefined
if islastbarupdate then
   if showZZ then
      //Last ZigZag
      drawsegment($zigzagidx[max(0,t-1)],$zigzag[max(0,t-1)],$zigzagidx[t],$zigzag[t])
   endif
   if showSR and $dir[t]=1 then
      drawsegment($zigzagidx[t],$zigzag[t],barindex,$zigzag[t])style(dottedline,3)coloured("green")
      drawsegment($zigzagidx[max(0,t-1)],$zigzag[max(0,t-1)],barindex,$zigzag[max(0,t-1)])style(dottedline,3)coloured("red")
      if $zigzag[t]<$zigzag[t-2] then
         drawtext("HL",$zigzagidx[t],$zigzag[t]+0.5*atr)coloured("green")
      else
         drawtext("HH",$zigzagidx[t],$zigzag[t]+0.5*atr)coloured("green")
      endif
   elsif showSR and $dir[t]=-1 then
      drawsegment($zigzagidx[t],$zigzag[t],barindex,$zigzag[t])style(dottedline,3)coloured("red")
      drawsegment($zigzagidx[max(0,t-1)],$zigzag[max(0,t-1)],barindex,$zigzag[max(0,t-1)])style(dottedline,3)coloured("green")
      if $zigzag[t]<$zigzag[t-2] then
         drawtext("LL",$zigzagidx[t],$zigzag[t]-0.5*atr)coloured("red")
      else
         drawtext("LH",$zigzagidx[t],$zigzag[t]-0.5*atr)coloured("red")
      endif
   endif
   if showLabels then
      drawpoint($zigzagidx[max(0,t-1)],$zigzag[max(0,t-1)],2)coloured("blue",100)
      drawpoint($zigzagidx[t],$zigzag[t],2)coloured("blue",100)
   endif

   //Draw all ZigZag
   for i=t-1 downto 3 do
      if showZZ then
         drawsegment($zigzagidx[max(0,i-1)],$zigzag[max(0,i-1)],$zigzagidx[i],$zigzag[i])
      endif
      if showSR and $dir[i]=1 then
         drawsegment($zigzagidx[i],$zigzag[i],$zigzagidx[i+1],$zigzag[i])style(dottedline,3)coloured("green")
         drawsegment($zigzagidx[max(0,i-1)],$zigzag[max(0,i-1)],$zigzagidx[i],$zigzag[max(0,i-1)])style(dottedline,3)coloured("red")
      elsif showSR and $dir[i]=-1 then
         drawsegment($zigzagidx[i],$zigzag[i],$zigzagidx[i+1],$zigzag[i])style(dottedline,3)coloured("red")
         drawsegment($zigzagidx[max(0,i-1)],$zigzag[max(0,i-1)],$zigzagidx[i],$zigzag[max(0,i-1)])style(dottedline,3)coloured("green")
      endif

      if showLabels and $dir[i]=-1 and $zigzag[i]>$zigzag[i-2] then
         drawtext("LH",$zigzagidx[i],$zigzag[i]-0.5*atr)coloured("red")
      elsif showLabels and $dir[i]=-1 and $zigzag[i]<=$zigzag[i-2] then
         drawtext("LL",$zigzagidx[i],$zigzag[i]-0.5*atr)coloured("red")
      elsif showLabels and $dir[i]=1 and $zigzag[i]>$zigzag[i-2] then
         drawtext("HH",$zigzagidx[i],$zigzag[i]+0.5*atr)coloured("green")
      elsif showLabels and $dir[i]=1 and $zigzag[i]<=$zigzag[i-2] then
         drawtext("HL",$zigzagidx[i],$zigzag[i]+0.5*atr)coloured("green")
      endif
   next
endif
//------------------------------------//
return
Comments
You must be logged in to post a comment.

Hi Ivan,
Great indicator! Finally one that is usable.
Could it be that there is a mixup in label, where it should be LH, where is says HL (maybe due to translation).
Also, with me it keeps redrawing and adding up HH/LH/LL/HL labels when the next bar comes. is that intended?
Kind Regards,
EJ
Hi! thanks :) write this line at the beggining of the code: defparam drawonlastbaronly=true


Really great code Ivan. Thank you very much for all your efforts. I have used a lot of your other indicators and it helps enormously to learn from you. You are an amazing resourse to have here.
Looking at the code I would like to overlay the different timescales. EG. I wanted to see the ZZ lines of the 1 hour on a 15min chart. I tried the rudimentary changing the Timeframe in the code to 1 hr but this did not work.
Is there a way to be able to do this? I will try some trial and error this weekend to see if I can find a way to do it.
Also - I want to try and use it within an Trading System to backtest. I noticed when I used the code in Market Replay it threw up extra lines. I will be discovering the nuances better as I dive deeper but just wondered if you had any guidance from your experience ?
Many thanks.
Thank you, I'm glad to be of help :) This indicator is not designed to be plotted across different timeframes. The reason is that it uses drawing commands, and this generates errors when changing timeframes due to the barindex. To solve what you mentioned about market replay, try adding this line at the beginning of the code: defparam drawonlastbaronly=true
Many thanks for the speedy reply. Is it possible then just to use the differing Points (HH, HL etc) from a different timeframe ? I am just trying to work out if it is possible to be able to use different points together. IE Within a 1 hr uptrend( HH and HL's ) that I can also log the HH's and HL's on the 15m timeframe ? Is there an easy way to achieve this in PRT ? Many thanks
Hello. Not easily. The entire logic of the indicator would have to be changed. Basically, a new indicator would have to be built.

Hello, really nice and working (nearly) perfectly well. Quick questions about the code . What means "zigzagidx". I understand zigzag but not with IDX. Same question for T . what is the value behind T. I also have 1 question about your code line 90 for i=t-1 downto 3 do, you are introducing a looping function but why value 3?
Hi, thanks! 1) zigzagidx is the array that stores the bar index (barindex) of each detected pivot. It allows us to know exactly where (in time) the pivot occurred, so we can draw the segments correctly on the chart. 2) t is simply a counter. Every time a new ZigZag point (HH, HL, LH or LL) is detected, t is incremented by 1 and used as the index to store the ZigZag values and their positions in the arrays: 3) As for the for i = t-1 downto 3 do, we use 3 as the minimum value because the code compares current values to i-2 (for example: $zigzag[i] > $zigzag[i-2]). To avoid accessing a negative or undefined index, we stop the loop at 3.

En mi modesta opinión de como entiendo este complicado mundo del trading, este indicador que has publicado es muy bueno para poder entrar en impulsos o correcciones y si se pudiera mejorar puliendo o reforzando sería casi perfecto, dejando claro que no existe el indicador perfecto, gracias por tus trabajos.
Hi, this is new version thanks to EJ.