







Wave momentums
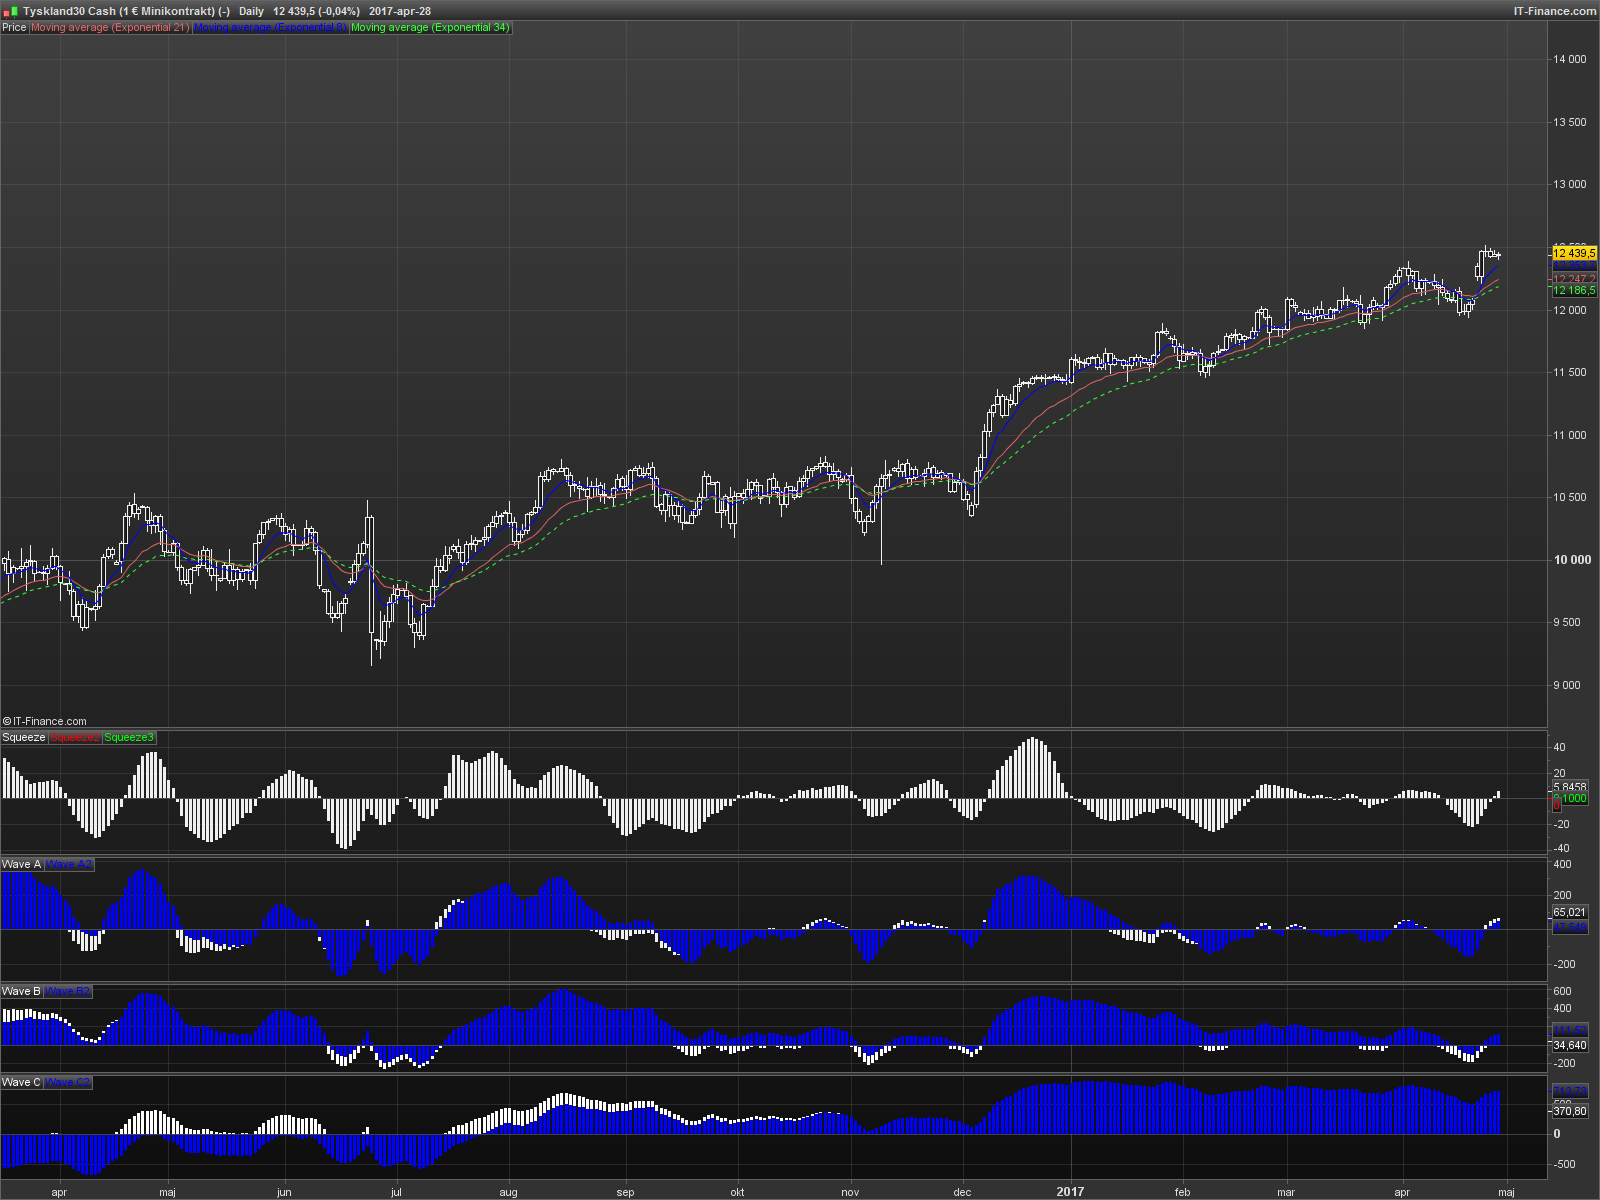
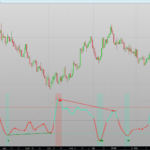
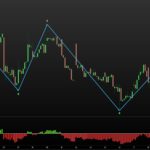
Waves is to visualize the overall strength and direction of a given market across multiple time frames.
Waves measuring short term (wave A), medium term (wave B) and long term momentum (wave C).
The A wave can be used as a signal on crossings of the zero line. Wave C shows the longer term trend and is most important for direction.
Wave A code:
A1= exponentialaverage[8](close)-exponentialaverage[34](close)- exponentialaverage[34](exponentialaverage[8](close)-exponentialaverage[34](close))

A2=exponentialaverage[8](close)-exponentialaverage[55](close)- exponentialaverage[55](exponentialaverage[8](close)-exponentialaverage[55](close))

return A1 coloured(255,255,255),A2 coloured(0,0,255)
Wave B code:
B1= exponentialaverage[8](close)-exponentialaverage[89](close)- exponentialaverage[89](exponentialaverage[8](close)-exponentialaverage[89](close))

B2=exponentialaverage[8](close)-exponentialaverage[144](close)- exponentialaverage[144](exponentialaverage[8](close)-exponentialaverage[144](close))

return B1 coloured(255,255,255),B2 coloured(0,0,255)
Wave C code:
C1= exponentialaverage[8](close)-exponentialaverage[233](close)- exponentialaverage[233](exponentialaverage[8](close)-exponentialaverage[233](close))

C2=exponentialaverage[8](close)-exponentialaverage[377](close)- exponentialaverage[377](exponentialaverage[8](close)-exponentialaverage[377](close))

return C1 coloured(255,255,255),C2 coloured(0,0,255)
Comments
You must be logged in to post a comment.

Hi swingforfortune,
Thanks a lot about your interesting posting. Let ask you to explain more about your indicator. It's very useful and intersteing. Thank again
Hello.
Basically they are a twist of the MACD histogram and can be used as such. They visualizes momentum in different time frames.
http://stockcharts.com/school/doku.php?id=chart_school:technical_indicators:macd-histogram#macd-histogram
You want the waves to all be positive or negative to be long or short. All above zero --> No shorts, buy dips.
Is momentum rising or falling are there any divergences to the price? This is what I look for.
Hope that helps.
Hi again
Thanks for the explanation. Have a good day