array variables availability in ProRealTime – examples and discussions

Forums ProRealTime English forum ProBuilder support array variables availability in ProRealTime – examples and discussions

Viewing 15 posts - 1 through 15 (of 208 total)
  • #118804

    The variable arrays will arrive soon in ProRealTime, they will be available in the coming weeks in version 11, with other instructions which I will detail in this topic.
    I consider this to be a major addition to the ProBuilder language and a radical change in the way we program and for this reason, I think that a topic in the forum is much more suitable for offering examples and discuss.

    Do not hesitate to ask your questions if things do not seem clear to you at first, I will try to answer as best I can.

    I will add concrete examples to this topic for future reference.

    As soon as these new features are deployed in public, you can also come here to offer your examples and your questions in the event of necessary debugging concerning variable arrays. There are so many new possibilities now, that 

    I have been testing for 2 weeks and apart from a few small concerns that have been brought up and corrected since, I must say that I was impressed by the quality and precision of the new instructions offered, thank you IT-Finance and ProRealTime, the year 2020 will be an amazing year for coders! 🙂

    In the introduction, I would like to recall what array variable is and why it is so important to be able to use it in programming.


    An array is a special variable, which can hold more than one value at a time.

    If you have a list of values (a list of recent highest high, for example), storing them in single variables could look like this:


    However, what if you want to loop through the highest high and find a specific one? And what if you had not 3 highest high to store, but 300?

    The solution is to create an array!

    An array can hold many values under a single name, and you can access the values by referring to an index number.

    In ProBuilder, variables array are declared with $ sign before their names, so following our previous example, our 3 variables could now be stored like this:


    Note that an array always begin at 0.

    This is how you should represent how the values are stored in an array:


    Each index represent a column of the table where you put a value that you will be able to access anytime and anywhere in your code.
    An index which hasn’t received any value yet is equal to 0.

    More dynamically, we could store values in an array like this:


    In this example, each time a new highest high is detected, we store its new value into a new column of the array. By using the instruction lastset(), we retrieve the last known column of the array, so by adding 1 to this number, we add dynamically a new column in order to store a new value. Don’t worry about the size of the array, it can handle 1 million index! Easy!

    Ready for our first example? See below.

    Total of 20 users thanked author for this post. Here are last 10 listed.
    #118817

    List of all examples available in this topic:


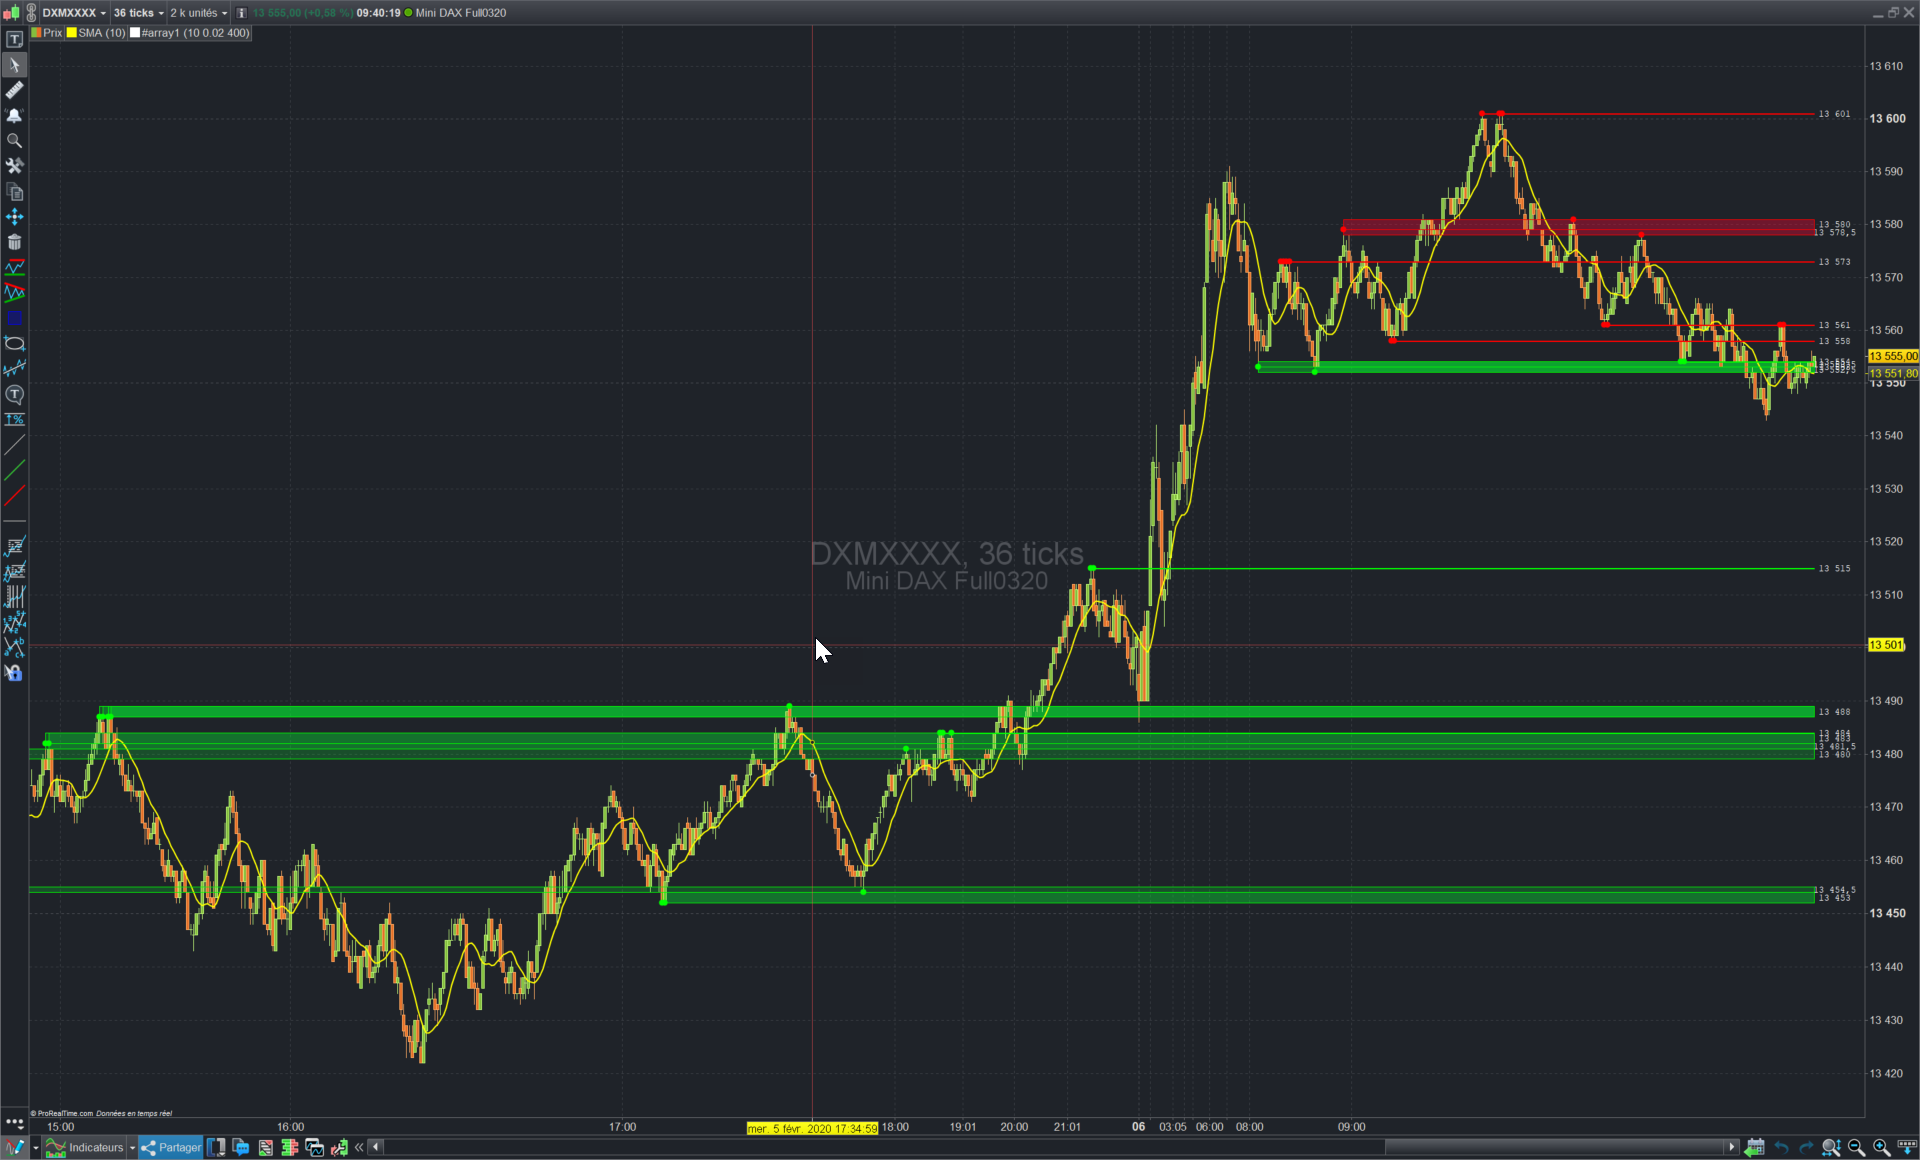
    Example #1: support and resistance example, based on fractals points

    This example calculate dynamically support and resistance zones based on 2 fractals found within a defined distance in percentage of price.

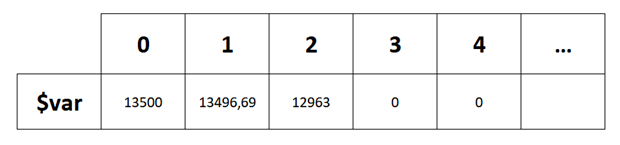
    Each time a new fractal is found, the code stores the value and the barindex in 2 separate arrays (2 variables for tops and 2 other variables for bottoms).

    On the last bar of the price chart, the code makes a loop through each index of the array, it selects the first index to compare it with all the other ones and if the distance in percentage is within the allowed threshold, then a new support or resistance zone is created. Then it moves to the next index and repeat and continue the loop. Note that I used nested loops in order to make the comparison.


    The code embed these new instructions:

    LastSet : Returns the last index of the array defined by the code. If no index was previously defined, the function returns -1.

    Example: LASTSET($Array)

    IsSet : Returns 1 if the index of the array has already been set in the code, otherwise returns 0.

    Example: ISSET($MyArray[Index])

    DrawPoint:Draws a point on the chart.

    Example: DRAWPOINT (x,y,size) COLOURED (R,V,B,a) BORDERCOLOR  (R,V,B,a)


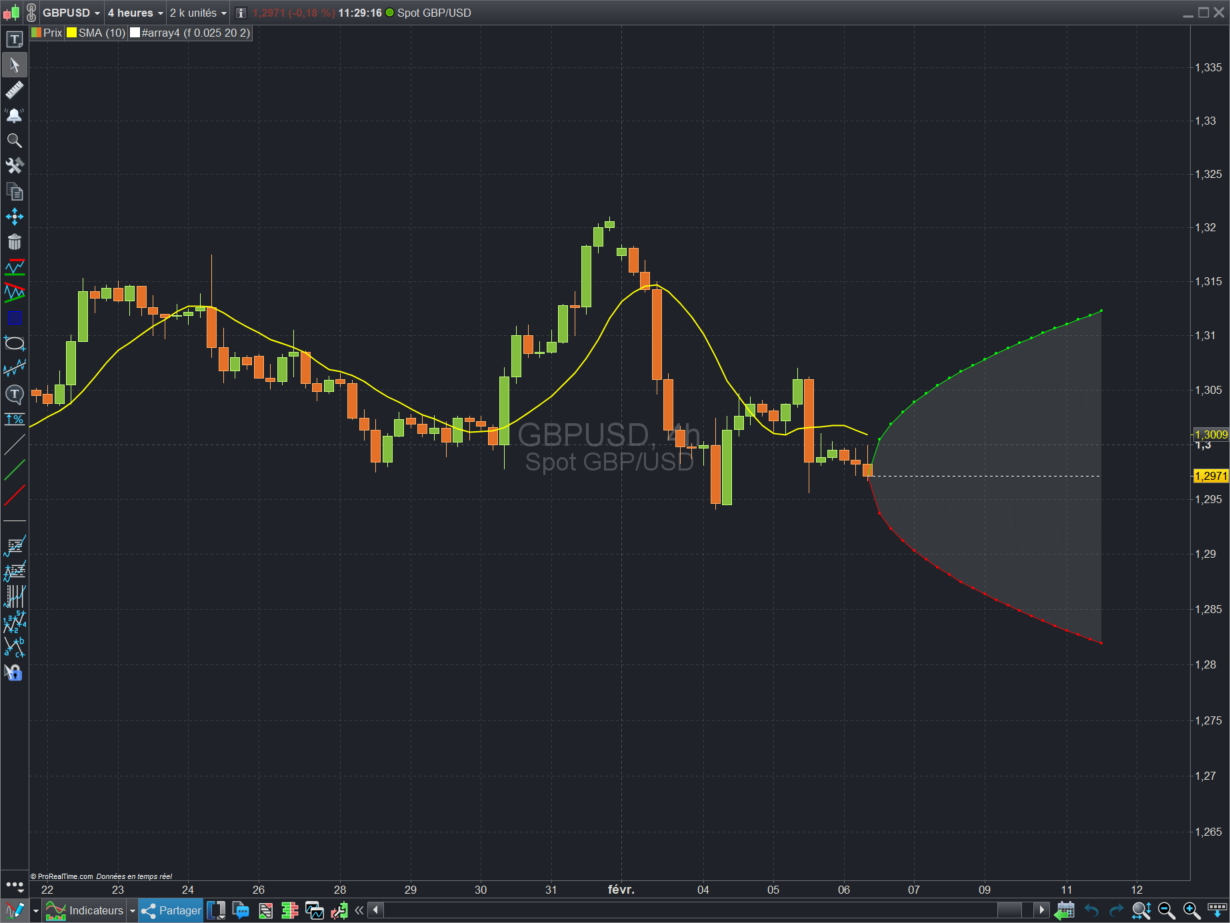
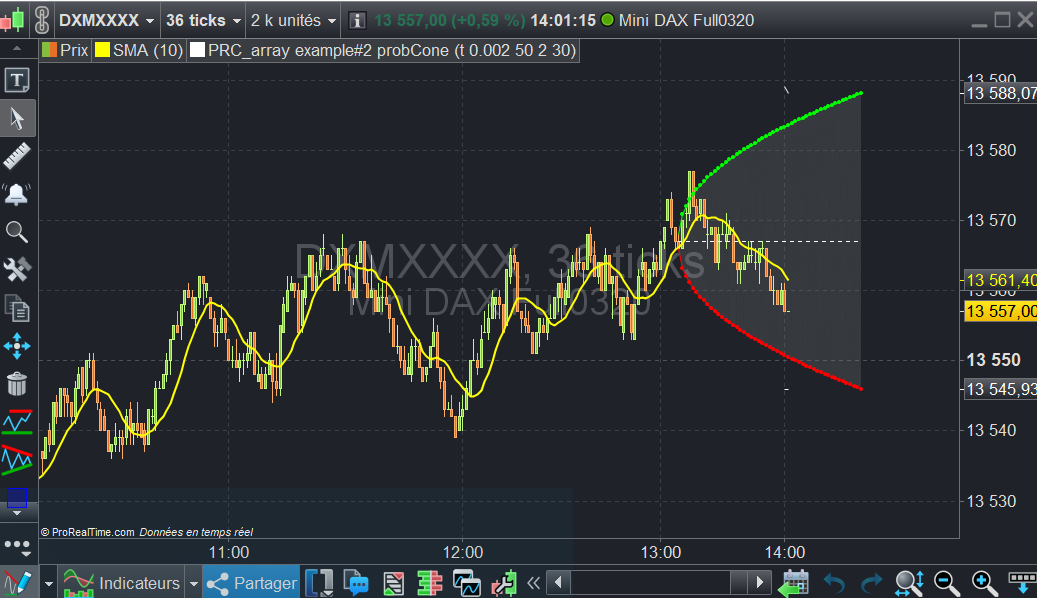
    You can also notice that it is now possible to plot in the future of the chart (at the right of the curent price) by using BARINDEX+x (or with DateToBarIndex )

    Feel free to fork the above code for your own needs (and please share it! 😉 ). The code is also attached below as an ITF file for convenience.

    Very nice fork of this code, by stefou102 can also be found here: Support and resistance zones with variables arrays

    Total of 14 users thanked author for this post. Here are last 10 listed.
    #118818

    Example #2: probability cone

    In this second example I created a probability cone with values stored in 2 separated variables array.

    The cone is plotted into the future of the price by using the 2 arrays. The start of the probability cone can be adjusted to start in the past (decay).

    Note that the arrays $u and $d are populated dynamically directly in a loop on the current candlestick.

    The code is continuously plotting the median high and median low values of the cone by using outside the loop the arraymin and arraymax instructions of $u and $d.


    It was not really necessary to use arrays to plot the cone because we do it in the loop on each iteration, but the purpose of the example was to show how to populate arrays inside a loop and use their values outside of it.

    The “vol” variable should be set with implied volatility of the instrument, but you can also use either historic volatility or even average true range factorized.

    5 users thanked author for this post.
    #118819

    Example #3: separate buy/sell volumes on the same candle

    With variable array, it is now possible to store values and to re-use it inside the same bar. Previously, it was not possible to refer to the last value because variables were reset on each new tick received from the market.

    IMPORTANT: arrays are not historized, they are decorrelated from the BARINDEX, it means that the arrays value from X bars ago is not saved in memory. It is not a drawback since you can save up to 1 million index which is the maximum of data history allowed now with version 11. Also, you can save your index into a normal variable and refer to it with its barindex offset (see example below, the ‘delta’ variable is used to store the difference of the 2 arrays, so that we can use it to compute an average over the last X periods!).

    In this example, we use only 1 index / value for each variable array, to benefit from their “memories” on the current bar, in order to “separate” the bullish from the bearish volumes. By making the difference between the 2 arrays, we can make a sort of accurate cumulative delta and usable in any timeframe from ticks to daily and beyond.


    1 user thanked author for this post.
    #118905

    In the probability cone example (Example 2) an error occurs on lines 25, 26, 28, 29 and 30.  A null error.

    It would seem like a very useful indicator if I could make it work.

    Perhaps this has not been implemented yet.


    Rory.

    1 user thanked author for this post.
    #118911

    The variable arrays will arrive soon


    #118920

    Indeed, this topic was created to prepare coders before the official public release of arrays 🙂

    I think that it is necessary to set milestones so that people take ownership of this new way of programming, which is not easy to define for those who have never programmed with variables arrays before. I may not have chosen the simplest examples, I will try to add others a little more accessible.

    #118929

    Example #4: previous days pivot point

    In this simple example, the code is storing the daily pivot points values into an array. Each new day, the current pivot points is put into a new index of the table. That way, we can get at any time and without making new calculation, the X previous day(s) pivot points value (with DaysBack setting). It is as if we are creating our own constants that we can reuse at any time later in our code, therefore the possibilities are numerous!

    In the attached picture, the “mypivot” line (thick white line) is plotting the pivot point from 2 days ago (DaysBack = 2).

    2 users thanked author for this post.
    #118958

    Thank you, I thought so.

    #119591
    MPL

    Hello Nicolas, Thank you very much for your feedback on the upcoming arrival of the arrays and the possibilities they will offer. I’m going to read it calmly and calmly tomorrow morning but after a first scan of your messages, it really looks very promising!

    #119600

    @MPL Thanks, I translated your post in English.

    I had not a lot of time this week to try and implement new things with arrays and I’ll certainly do next week!

    #119925

    This is great news. I would like to percentile rank price moves (of say DAX Futures) from 8.00am (UK time) to 8.00am + x minutes. Until now, without arrays, it’s been virtually impossible.

    #120021
    MPL

    Hello everyone, hello Nicolas,

    1. I have read and understood your examples, very interesting, thank you very much
    2. Do you know what will be the date of the release which will allow us to have arrays
    3. Do you know if there will be instructions to facilitate the manipulation of arrays :
    – Ex1: rank array in ascending or descending order (trier un tableau)
    – Ex2: merge 2 arrays
    – …

    Point 3 is not very important since it will always be possible to do this “by hand” with a few loops …

    Thank you

    #120024

    I think that we are closed to a release in version 11. I already asked for an “array sort” instruction which is not available, it will be added but I don’t know when.

    1 user thanked author for this post.
    avatar MPL
    #120531

    Hello Nicolas,

    This topic on the tables to come seems super interesting, and risks revolutionizing our indicators (support / resistance – trend lines / number of times affected … etc) do you have any news concerning this long awaited shift?

    Thanking you in advance,


    Vincent

Viewing 15 posts - 1 through 15 (of 208 total)
Similar topics:

Create your free account now and post your request to benefit from the help of the community
Register or Login