



More from ProRealCode
ProRealCode - Trading & Coding with ProRealTime™
The ProRealTime™ community on the web! Officially sharing ProRealTime knowledge to Worldwide users since 2015!



One of the most valuable stop losses (Based on Ichimoku and ATR)
January 12, 2021, 2:31 PM
Indicators
7 Comments
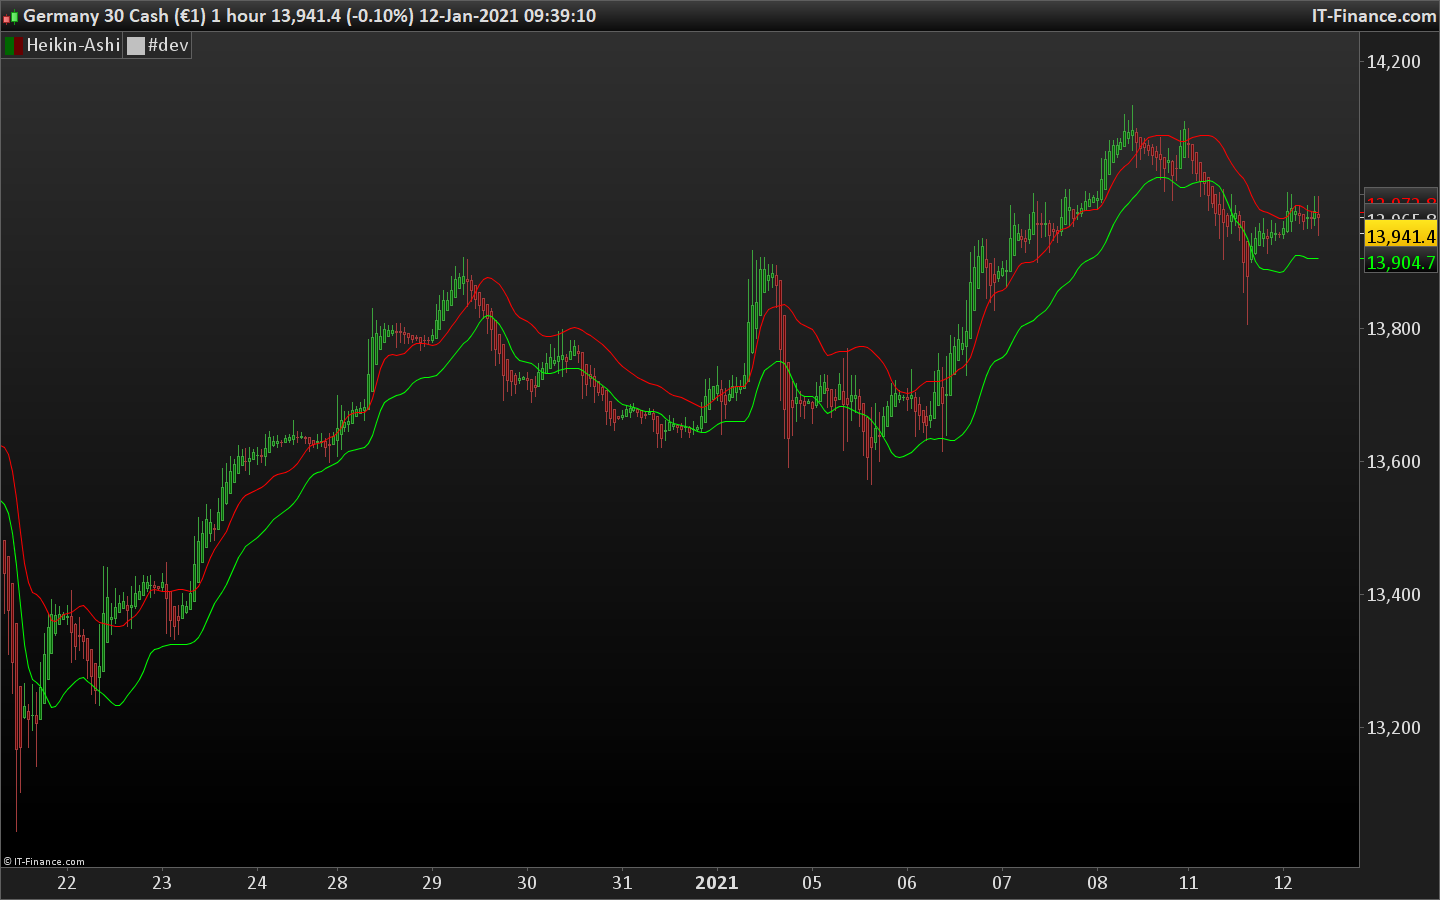
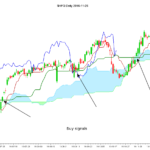
This indicator is using the mean of Ichimoku Kijun of periods 9 and 26. That value is smoothed with a triangular average. Then 89% of the ATR 14 periods is added and subtract to create the long and short stoploss lines you can see on the picture.
//Zigo

//Written in One-Note 26/11/2014 (10:07)
//Published in PRT 8/01/2021
//Calculation the Stop losse Long and Short
c1=(highest[9](high)+lowest[9](low))/2
C2= (highest[26](high)+lowest[26](low))/2
c3=(c1+c2)/2

//Dynamic for Long positionsx
//Dynamic stop for Short positions
stlong=TriangularAverage[5](c3- 0.89*AverageTrueRange[14](close))
stshort=TriangularAverage[5](c3+0.89*AverageTrueRange[14](close))

Return stLong coloured(0,255,0) as"StopLong", Stshort coloured(255,0,0) as "StopShort"
Download
Filename:
Ichimoku-and-ATR-stoploss.itf
Downloads:
361
Master
This author is like an anonymous function, present but not directly identifiable. More details on this code architect as soon as they exit 'incognito' mode.
Author’s Profile
Similar code
Ichimoku Price PatternIndicators
Ichimoku Tenkan-Kijun CrossIndicators
Advanced Trend TraderStrategies
Comments
You must be logged in to post a comment.

Dear Zigo please can you help me ? it must be easy for you ... I need to plot a mid line between these 2 lines ...For example if the red line is at 1300 and the green line is at 1250 then the mid line = (1300+1250)/2=1275 The mid line should be very thick and different color So PLEASE can you tell me what line should i add to your code ? Many Thanks Best Regards Dimitris ( from Greece )
Loading...
thanks