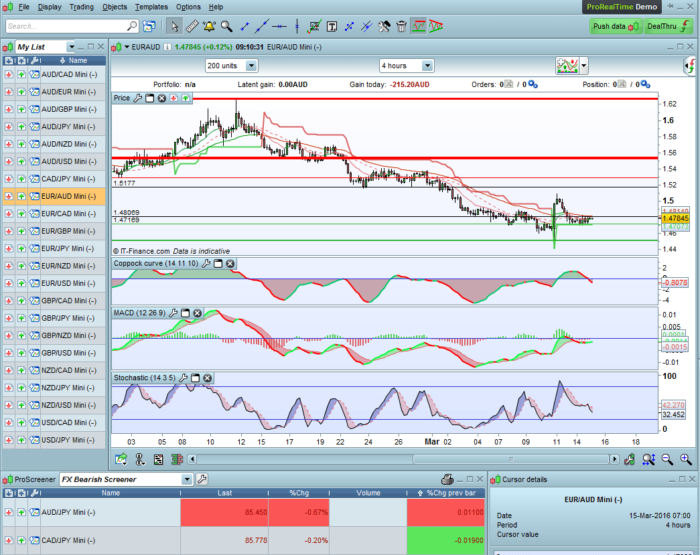
These is a very effective screeners that will form the basis of an automatic system. I have been using them for about 5 years with great success.
Forex Bearish Screener:
|
1 2 3 4 5 6 7 8 9 10 11 12 13 14 |
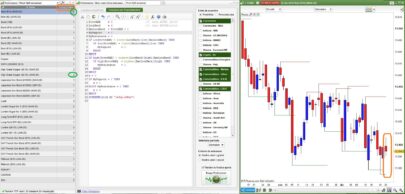
///Forex Bearish Screener - run on 4 hour FX Mini Charts TIMEFRAME(4 hours) indicator1 = CALL "MGC-Coppock"[14, 11, 10](close) c1 = (indicator1 < indicator1[1]) TIMEFRAME(4 hours) indicator3 = MACDline[12,26,9](close) c2 = (indicator3 < indicator3[1]) TIMEFRAME(4 hours) indicator5 = Stochastic[14,3](close) c3 = (indicator5 < 80) c4 = (indicator5 > 60) c5 = (indicator5 < indicator5[1]) SCREENER[c1 AND c2 AND c3 AND c4 AND c5] (Variation AS "%Chg prev bar") |
Forex Bullish Screener:
|
1 2 3 4 5 6 7 8 9 10 11 12 13 |
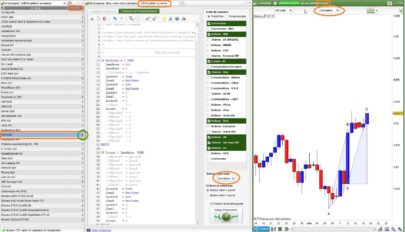
//Forex Bullish Screener - use with 4 hour Mini FX Charts indicator1 = CALL "MGC-Coppock"[14, 11, 10](close) c1 = (indicator1 > indicator1[1]) indicator3 = MACDline[12,26,9](close) c2 = (indicator3 > indicator3[1]) indicator5 = Stochastic[14,3](close) c3 = (indicator5 > 20) c4 = (indicator5 < 40) c5 = (indicator5 > indicator5[1]) SCREENER[c1 AND c2 AND c3 AND c4 AND c5] (Variation AS "%Chg prev bar") |
To set it up you will need a new indicator I call “MGC-Coppock” as PRT does not offer the Coppock as such. The code is:
|
1 |
RETURN WEIGHTEDAVERAGE[MA](ROC[roc1] +ROC[roc2]) AS "Coppock Indicator" |
I have uploaded both screeners in .itf format that can be imported straight into your PRT.
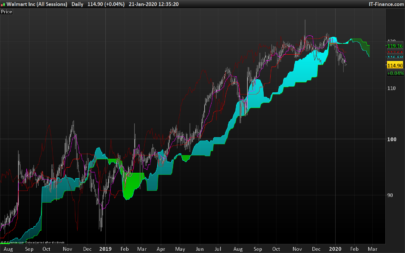
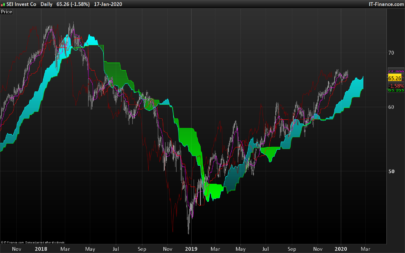
Please note that these screeners can also be used for stocks and indices.
Remember to limit the size of the scan by having them only scanning your list of preferred instruments e.g. top 200 stocks, or high volatility Forex pairs.
Share this
No information on this site is investment advice or a solicitation to buy or sell any financial instrument. Past performance is not indicative of future results. Trading may expose you to risk of loss greater than your deposits and is only suitable for experienced investors who have sufficient financial means to bear such risk.
ProRealTime ITF files and other attachments :
Find other exclusive trading pro-tools on ![]()
PRC is also on YouTube, subscribe to our channel for exclusive content and tutorials


Hello Mike and thanks a lot for your precious contribution!
Hello Mike. You’re screener are very interesting. I can see they are made to work on H4 timeframe. To take position, do you zoom into smaller timeframe and search for entries going the same way your screener indicate in H4 ? Based on the same indicators ?
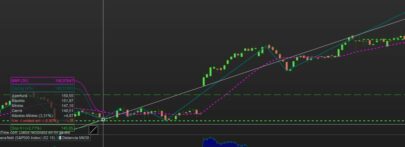
Hello Sofitech, I use these screeners to minimise the time looking for trades in FX. Before I take a trade on the H4 chart, I check the D1 and the H1 and see whether the trend is in favour. They can give signals that could become reversals, but that is a risky trade without looking at the price action. Also it is probably better to wait for the candle to close on the H4. The benefits are that the confluence of 3 indicators should provide a lesser risk as you would know, trading the Ichimoku.
Hope this helps.
Best regards,
Mike
Thanks for your answer. I will have a look on your screener results soon. But i like the logic of it. As you say in another post, the stop or trailing stop is the key…
Hope for you this forum and Nicolas will help you to improve your system and maybe to find a way to make it autotrade.
Regards.
Thanks, Sofitech. Nicolas is working on it now. It is a bit tricky, there being so much visual input. Am considering a trend indicator on the D1 such as Zig-Zag. In fact the NZDJPY D1 is now 14 days into a new uptrend with the H4 showing bullish – it may be worth a look.
Hello Sir,
Nice system, thanks for sharing.
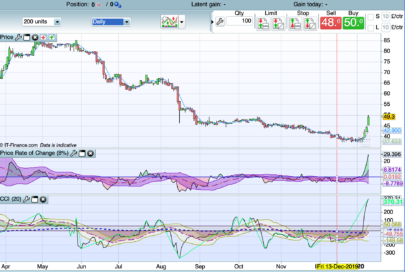
Maybe we could try to automate this strategy. For example, if all the conditions are met, we could set an automatic order of buying / selling, with stop loss and take profit (I personally like using ATR for this ; we can also code the “last swing high / low”, but it’s a bit difficult).
Greetings,
Hello Doctrading,
Nicolas has written some really elegant code for me that works well, but I find that there are other factors that need to be taken into account when setting a trade based on the screeners. You may have noticed that not every screened pair is necessarily a good trade. The two main problems are:
The direction of the trend. I am trialing Zig Zag as a source of this information, and find it reasonably reliable.
Coding the trailing stop loss cum exit.
Zig Zag may be able to provide a good swing high/low. However I have noticed that it can sometimes change when the trend shifts from a short term reversal back to the longer-term trend.
I think that a multiple of the ATR might be the answer.
Or a choice of the tighter of the two.
With the exit, I have been using the Super Trend as a stop loss. After the ST flips over, it is wonderful for a long trending trade. I have experienced some great trades with this. The longest was for 195 days on an AUDUSD short in September 2014. It made 1388 pips.
Thanks for your interest in this. I have been using the system and some variants for years with good success. However, I would appreciate your suggestions, comments and insights. I am planning to build the above factors into the code and if they test successfully, then I will post it with Nicolas’ permission.
Good trading,
Mike
Hi Mike ,
im having problems getting the indicator coding i keep getting :
Syntax error:The following variable is undefined: maThe following variable is undefined: roc1The following variable is undefined: roc
apologies if i’m being naive but any advice would be greatly appreciated.
Hello Tradingsales,
The reason for your error messages is probable because the screeners call for the indicator MGC-Coppock. I created this at the time when PRT didn’t offer a Coppock. Thus you now have two options:
set up the MGC-Coppock indicator as described above: To set it up you will need a new indicator I call “MGC-Coppock” as PRT does not offer the Coppock as such. The code is: RETURN WEIGHTEDAVERAGE[MA](ROC[roc1] +ROC[roc2]) AS \"Coppock Indicator\" or
download the PRT indicator Coppock Curve and change the screeners’ codes accordingly.
Let me know how you get on.
Cheers, Mike
RETURN WEIGHTEDAVERAGE[MA](ROC[roc1] +ROC[roc2]) AS “Coppock Indicator”
This code alone as indicator does not work.
The PRT indicator Coppock Curve as different parameters and does not work with CALL “MGC-Coppock”[14, 11, 10](close)
Cannot use both your screener.
Hi Mike,
Hope you will get this message as this interresting stuff was posted some time ago…
Coopock curve is generally described as a 10-weighted average of 14ROC + 11 ROC… Looks like you are using 14-weighted average of 11ROC + 10 ROC… My mistake ? Or done intentionnaly by yourself ?
Moreover you are saying : “Nicolas has written some really elegant code for me that works well…” but I cannot find that piece of code on ProRealCode ? Maybe Nicolas can help on this as well.
Many thanks again for this very interresting idea.
BR,