







Screener for bullish stocks
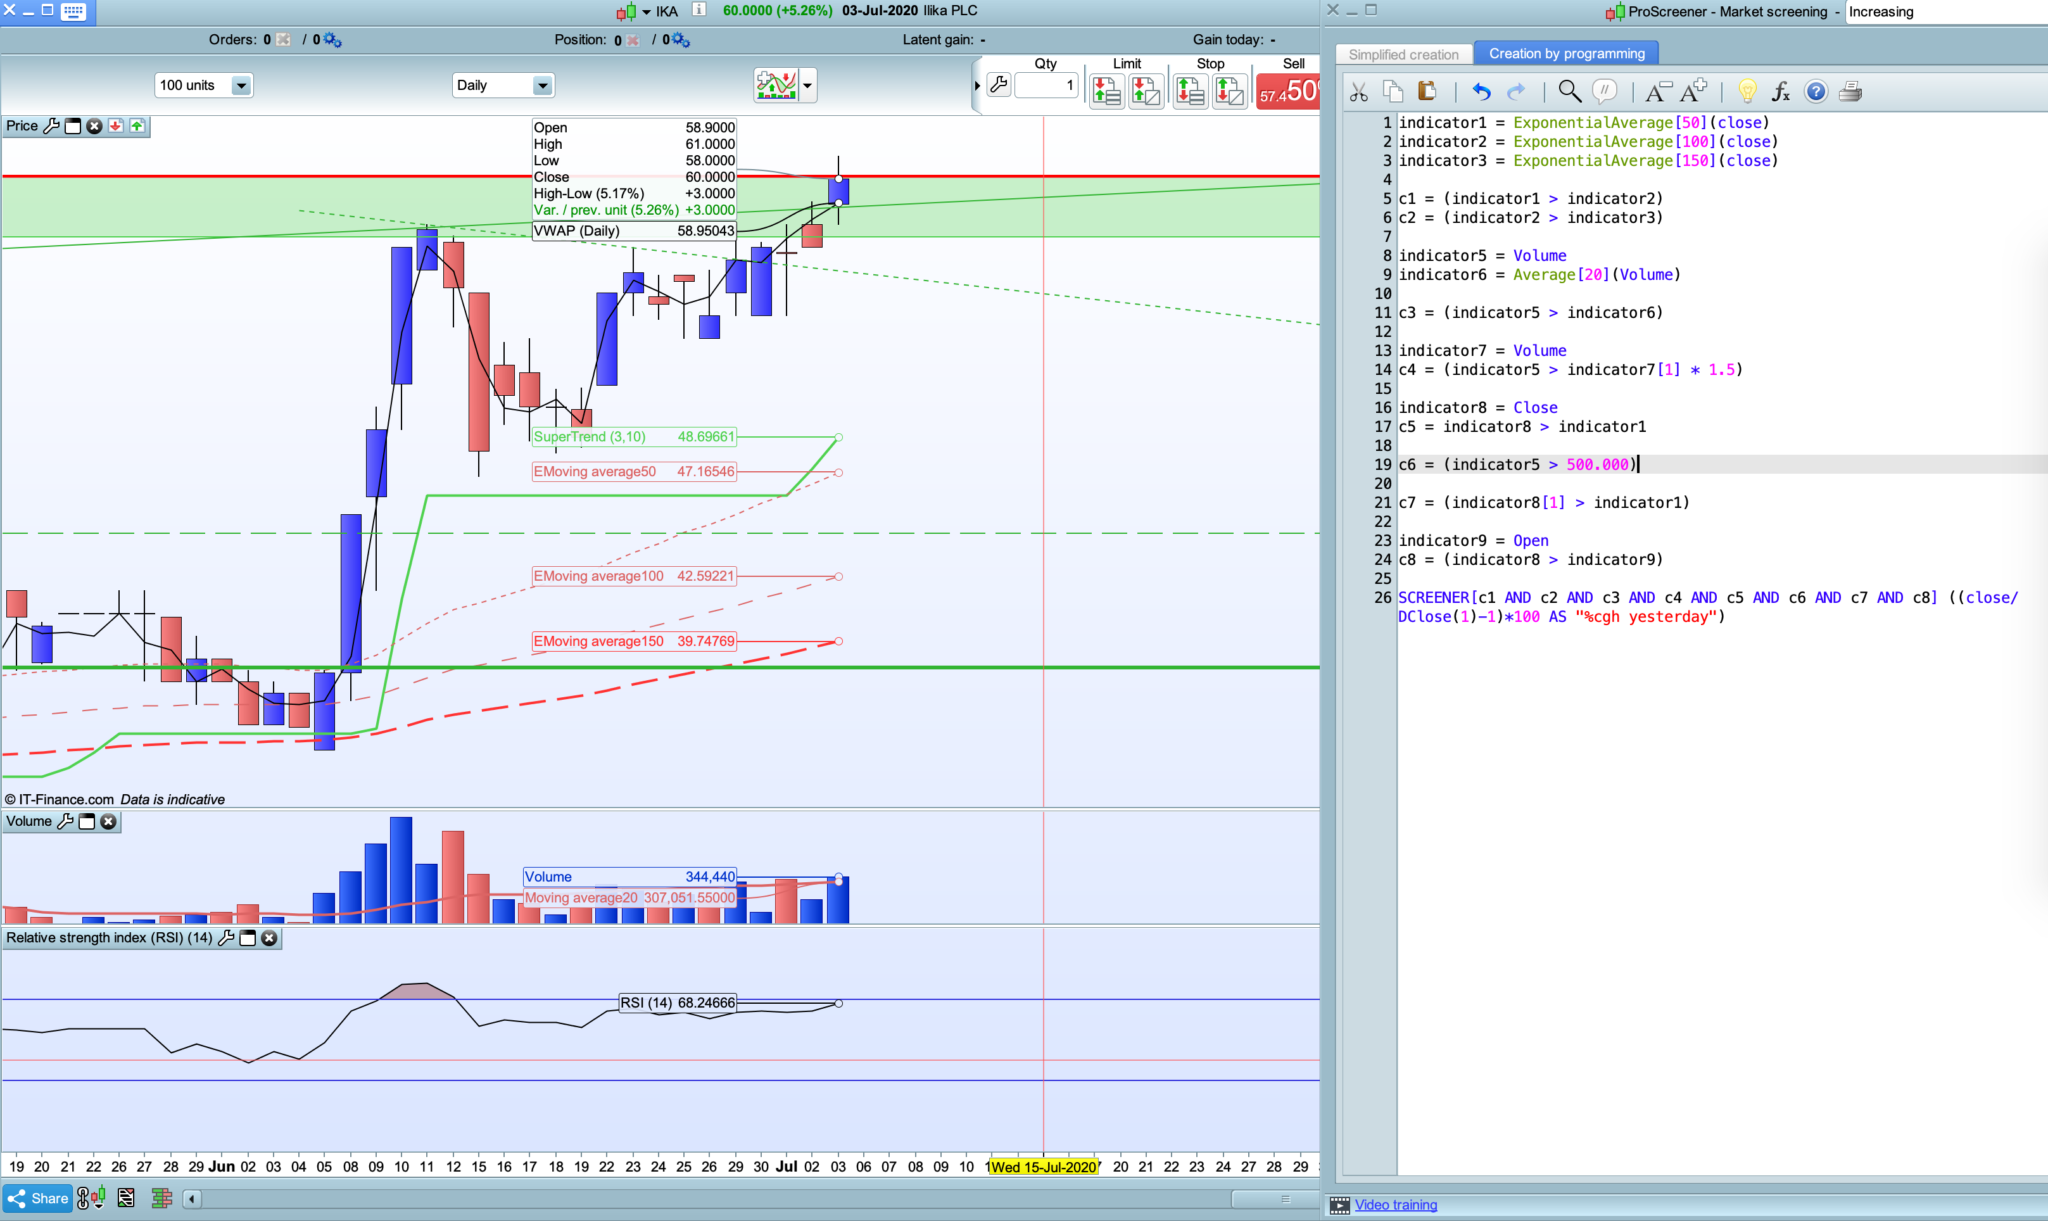
Simple and effective way to find bullish stocks.
It works perfect for Day Trading
Formula is:
Price > EMA(50) > EMA(100) > EMA(150)
Volume > 50% Previous Volume && Volume > SMA(20)
indicator1 = ExponentialAverage[50](close)
indicator2 = ExponentialAverage[100](close)
indicator3 = ExponentialAverage[150](close)
c1 = (indicator1 > indicator2)
c2 = (indicator2 > indicator3)

indicator5 = Volume
indicator6 = Average[20](Volume)

c3 = (indicator5 > indicator6)

indicator7 = Volume
c4 = (indicator5 > indicator7[1] * 1.5)

indicator8 = Close
c5 = indicator8 > indicator1

c6 = (indicator5 > 500.000)

c7 = (indicator8[1] > indicator1)

indicator9 = Open
c8 = (indicator8 > indicator9)

SCREENER[c1 AND c2 AND c3 AND c4 AND c5 AND c6 AND c7 AND c8] ((close/DClose(1)-1)*100 AS "%cgh yesterday")
Comments
You must be logged in to post a comment.

Here is the version for bearish stocks: indicator1 = ExponentialAverage[50](close) indicator2 = ExponentialAverage[100](close) indicator3 = ExponentialAverage[150](close) c1 = (indicator1 < indicator2) c2 = (indicator2 indicator6) indicator7 = Volume c4 = (indicator5 > indicator7[1] * 1.5) indicator8 = Close c5 = indicator8 500.000) c7 = (indicator8[1] < indicator1) indicator9 = Open c8 = (indicator8 < indicator9) SCREENER[c1 AND c2 AND c3 AND c4 AND c5 AND c6 AND c7 AND c8] ((close/DClose(1)-1)*100 AS "%cgh yesterday")

Cheers - Been trying configure for weekly-trading. Anyone configured it for weekly buys and had some decent results? Eg. buy those bullish medium-term on Mondays - close Fridays .
// EMA9 increasing ema9 = ExponentialAverage[9](close) c1 = (ema9 > ema9[1]) // EMA20 increasing ema20 = ExponentialAverage[20](close) c2 = (ema20 > ema20[1]) // EMA9 > EMA20 c3 = (ema9 > ema20) // Vol over SMA20 vol = Volume // Current vol 20% bigger than previous c5 = (vol > vol[1] * 1.20) // Close > EMA9 currentclose = Close c6 = currentclose > ema9 // Vol bigger than 200k c7 = (vol > 200000) // Prev close > EMA9 -> second candle that increases c8 = (currentclose[1] > ema9) // It closes possitive currentopen = Open c9 = (currentclose > currentopen) highCurrent = High highPrevious = High[1] c10 = (highCurrent > highPrevious) SCREENER[c1 AND c2 AND c3 AND c5 AND c6 AND c7 AND c8 AND c9 AND c10] ((close/DClose(1)-1)*100 AS "%cgh yesterday")

I meant 500k, but you are right, as it is is interpreted as 500, sorry I am new on PRT and of course to the values they use, as well to this programming language. Actually Im trying to find a way to edit this screener, as I would like to add ema9 as well, which is what I used yesterday to detect bullish US stocks and it worked quite well, so I will just post the version I used yesterday here on this comment:

@omidnajaf this will give you DAX/currencies/etc, volume is not in part of the conditions anymore // EMA9 increasing ema9 = ExponentialAverage[9](close) c1 = (ema9 > ema9[1]) // EMA20 increasing ema20 = ExponentialAverage[20](close) c2 = (ema20 > ema20[1]) c3 = (ema9 > ema20) // Close > EMA9 currentclose = Close c6 = currentclose > ema9 // Prev close > EMA9 -> second candle that increases c8 = (currentclose[1] > ema9) // It closes possitive currentopen = Open c9 = (currentclose > currentopen) highCurrent = High highPrevious = High[1] c10 = (highCurrent > highPrevious) SCREENER[c1 AND c2 AND c3 AND c6 AND c8 AND c9 AND c10] ((close/DClose(1)-1)*100 AS "%cgh yesterday")
This gives awesome results ! Thanks Is there a way to transform it into a bearish version ?