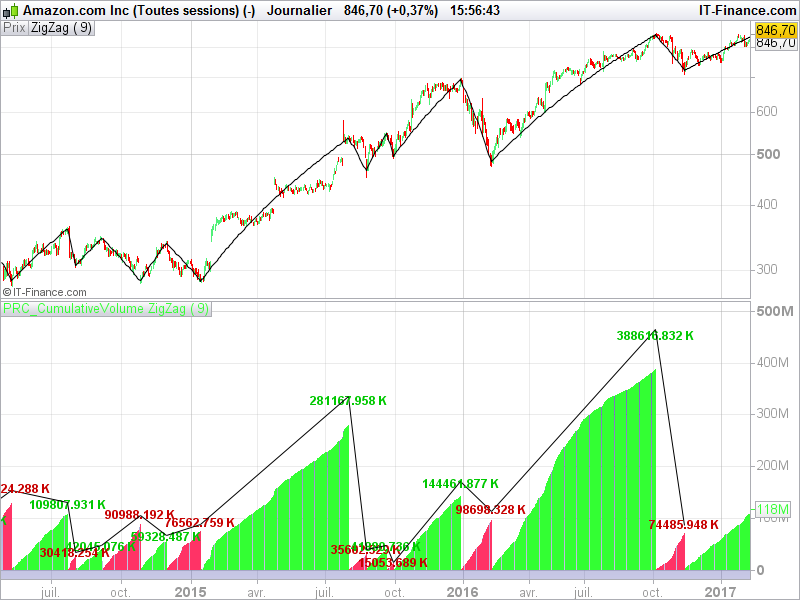
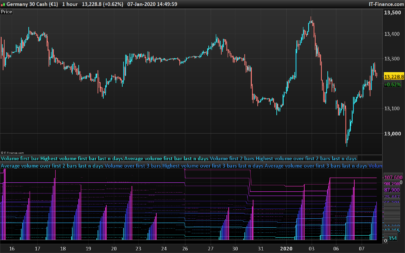
The theory is based on R Wyckoff works and refined by D Weis. In the nutshell cumulative volume helps to asses the strength of the ZigZag section which is difficult to measure if you looking at the individual volume bars only.
This indicator has been coded from a request on the english support forum:
https://www.prorealcode.com/topic/zigzag-with-cumulative-volume/
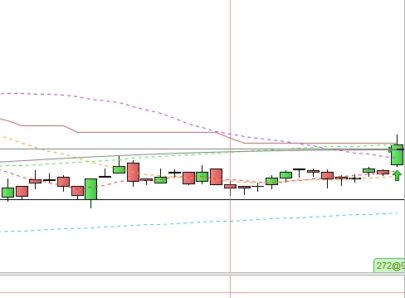
The indicator is based on percent variation ZigZag, the new peak or tough are triggered by a new price variation of X percent you can change with the “percentVariation” parameter in the indicator window.
I hope it will be helpful for people interested in Wave Weis analysis.
|
1 2 3 4 5 6 7 8 9 10 11 12 13 14 15 16 17 18 19 20 21 22 23 24 25 26 27 28 29 30 31 32 33 34 |
//PRC_CumulativeVolume ZigZag | indicator //17.02.2017 //Nicolas @ www.prorealcode.com //Sharing ProRealTime knowledge // --- parameters // percentVariation = 9 zz = ZigZag[percentVariation](close) peak = zz<zz[1] and zz[1]>zz[2] tough = zz>zz[1] and zz[1]<zz[2] cumV = cumV+volume if peak then text = cumV/1000 drawtext("#text#K",barindex[1],cumV[1]+0.17*cumV[1],Dialog,Bold,12) coloured(0,200,0) drawsegment(barindex[1],cumV[1]+0.20*cumV[1],previousX,previousY) cumV = Volume color = -1 previousX = barindex[1] previousY = cumV[1]+0.20*cumV[1] elsif tough then text = cumV/1000 drawtext("#text#K",barindex[1],cumV[1]+0.23*cumV[1],Dialog,Bold,12) coloured(200,0,0) drawsegment(barindex[1],cumV[1]+0.20*cumV[1],previousX,previousY) cumV = Volume color = 1 previousX = barindex[1] previousY = cumV[1]+0.20*cumV[1] endif return cumV coloured by color |
Share this
No information on this site is investment advice or a solicitation to buy or sell any financial instrument. Past performance is not indicative of future results. Trading may expose you to risk of loss greater than your deposits and is only suitable for experienced investors who have sufficient financial means to bear such risk.
ProRealTime ITF files and other attachments :
Find other exclusive trading pro-tools on ![]()
PRC is also on YouTube, subscribe to our channel for exclusive content and tutorials


Nicolas, is it possible to use this indicator for Gold trading at IG Market?
This indicator will work for any instrument which have Volumes information from the broker.
Hello Nicolas,
again a really nice indicator! I have no coding skills, but can you or someone else change the code, so that the red candles are under 0 and the green stay over 0?
Best wishes zeter 🙂
Not sure to perfectly understand, you want the red histogram to be under 0?
Hello Nicolas,
I have a cumulative histogram update problem, the indicator often updates only after restarting the indicator, what should I try to do?
Salut Nicolas. Je aimerais aussi que le volume des ventes était sous 0. Je pense que ce serait un bon filtre pour une utilisation dans un système automatisé avec Ichimoku.
Merci beaucoup pour l’indicateur
Voici le lien pour la version avec Volumes négatifs si le dernier ZigZag était un “peak”.
https://www.prorealcode.com/topic/zigzag-with-cumulative-volume/page/2/#post-25828
Same request. Having the red histogram value in négative. And the green in positive. For the red, to keep the same volume values but with – (under 0)
.. don’t understand this interest since it is only a well known zigzag indicator?!
What i like is not the ZZ part of the indicator. Think i would switch with some kind of moving average in the code. But the histogram volume count. So… having the histoGram in positive and negative would be cool.
Please add this request on probuilder forum. Thanks.
Here is the link for the new version with cumulative Volumes as negative values when the last ZigZag was a peak.
https://www.prorealcode.com/topic/zigzag-with-cumulative-volume/page/2/#post-25828
Merci Nicolas pour cet indicateur et pour les précédents aussi! Je n’arrive pas à comprendre son fonctionnement et comment puis-je l’utiliser en intraday ! Merci encore.
Come posso fare per inserire uno proscreener che mi trovi quando lo zig zag cumulative presenti una candela verde?
https://www.prorealcode.com/topic/screener-cvzz/
Grazie Nicolas
Bonjour Nicolas , j’ai étudié cet indicateur et pour moi il repeint? est ce normal ou je ne sais l’utilisé?
Bien sûr, celui-ci étant basé sur la détection des pics et creux façon “zigzag”, on ne peut jamais être sûr qu’un plus haut sera bien toujours le plus haut à la bougie qui suit.. Et vice versa pour les plus bas bien entendu.
Hello Nicolas,
pls I don’t know what I have done wrong, cos this indicator don’t work on my chart when insert it, it will appear in an area form and not exactly the way it is on the site. pls, help. Many Thanks Boby
Do not add it on price, but like a usual oscillator indicator instead. Be sure that the instrument got Volumes.
Thank you, Nicolas, for the swift response, however, i do add it as an oscillator not on chart and am getting the same result
Hi Nicolas. Thanks for this helpful indicator. I wonder if you’d consider a modification? My idea is to plot the cumulative swing vol on the price chart, but as line thickness. For example, if the swing has high volume, it’s thick, if low it’s thin… with graded thickness. I’d love to do this myself but lack the coding skills. Would you mind please? Many thanks.
Bonjour Nicolas, en trading automatique avec la dernière version de ProRealCode: la fonction ZigZag est renseignée comme obsolète – comment détourner celà? – merci d’avance
Pas obsolète mais impossible à utiliser pour le trading automatique sous ProOrder. Je vous encourage à essayer d’autres techniques pour trouver les pics et les creux (plus haut / plus bas).
Hi Nicolas. Thank you for this excellent indicator. I am using it in particular for Wykoff-Weis analysis.
Are you able to advise how i would also calculate the price movement of each swing. i.e. if it is an upswing, the price delta would be the close – trough price. Else if it is a downswing, the price delta wold be a peak price – close. This is the Weis Pip Swing wave. similar to the volume wave, just calculating the price movement of each swing.
Sure, please open a new topic in the probuilder forum with all specifications needed.
Hola, funciona en P11? lo he puesto y no me sale como en la imagen. gracias.