
This is an alternative version of the ‘Yearly Quarterly Monthly Weekly Daily H4 H1 OHLC Lines’ indicator that can be found here:
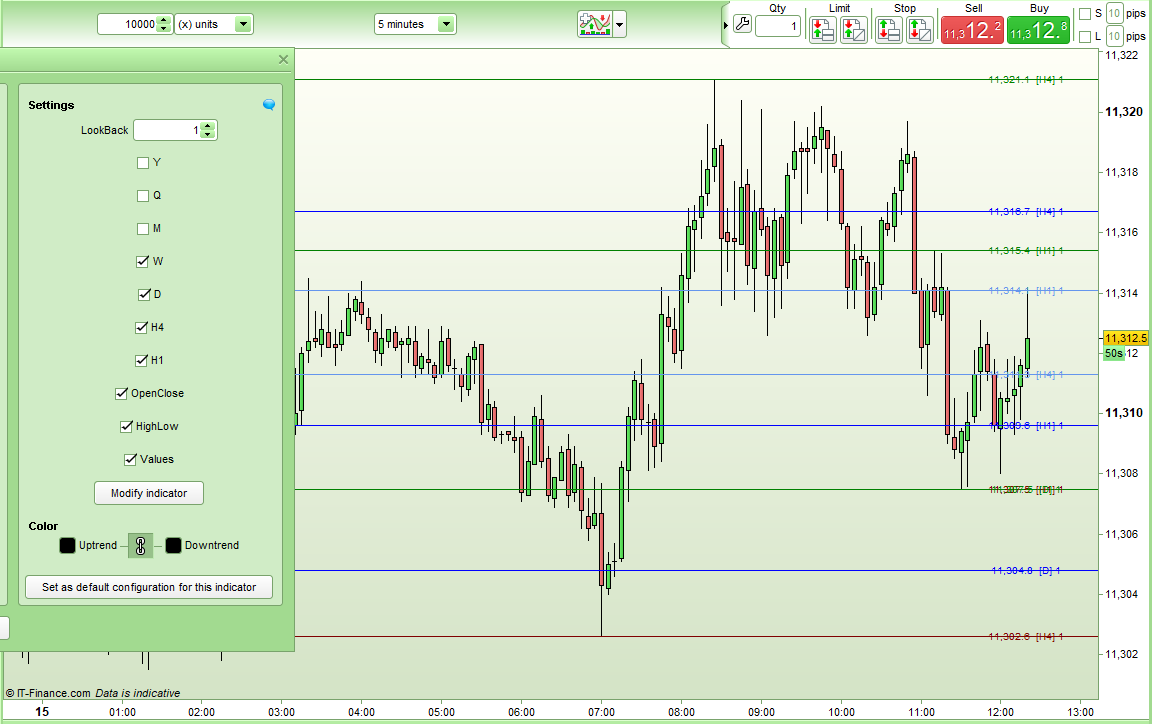
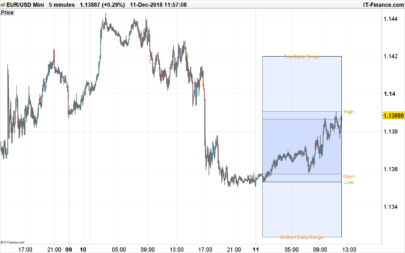
This version only draws the latest open, high, low and close lines and labels them so that you know which period they are drawn from and what price they are at.
As with the first version you can turn off any periods that you don’t want to see. You can also select whether you see just open and close lines or just high and low lines or all of them. You can also turn off the displayed price by using the ‘Values’ setting.
As with the first version you can set a look back period so that you can see the OHLC from any period. So you can plot lines from 2 months ago or 2 days ago or 3 weeks ago etc. By applying the indicator multiple times to a chart with different look back settings you can have for example the OHLC values from the last three months on the chart.
All lines are labelled with price first followed by the period in [ ] and then the look back period. The lines are colour coded as follows:
- Open = light blue
- High = green
- Low = red
- Close = dark blue
So for example:
- 1029.5 [D] 2 in green = the high from 2 days ago which was at a price of 1029.5
- 1054.2 [H1] 1 in red = the low from the last hour which was at a price of 1054.2
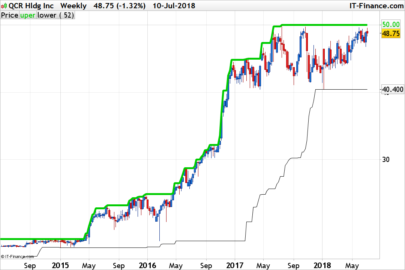
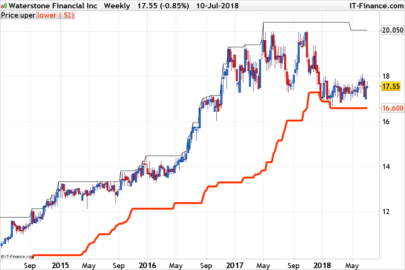
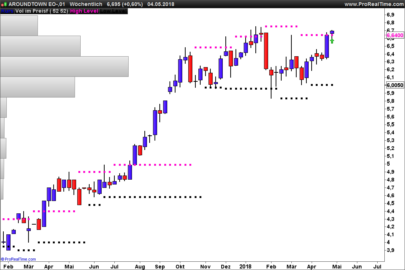
This indicator can be used to recognize possible support and resistance levels and for breakout trading.
I recommend using this indicator alongside my ‘Last Two Highest High and Lowest Low as Horizontal Lines – Yearly Quarterly, Monthly, Weekly, Daily, 4 Hour and 1 Hour’ indicator. This will give you lines representing the extension of connecting the last two highs and last two lows of each period. The two indicators plotted on the same chart can show you levels that others may be looking at. The labels in this indicator are not in [ ] so you can know whether you are looking at a horizontal OHLC line or the extension of a line connecting highs or lows when both indicators are on the same chart. That indicator can be found here:
I advise downloading and importing the ITF file to get full functionality.
|
1 2 3 4 5 6 7 8 9 10 11 12 13 14 15 16 17 18 19 20 21 22 23 24 25 26 27 28 29 30 31 32 33 34 35 36 37 38 39 40 41 42 43 44 45 46 47 48 49 50 51 52 53 54 55 56 57 58 59 60 61 62 63 64 65 66 67 68 69 70 71 72 73 74 75 76 77 78 79 80 81 82 83 84 85 86 87 88 89 90 91 92 93 94 95 96 97 98 99 100 101 102 103 104 105 106 107 108 109 110 111 112 113 114 115 116 117 118 119 120 121 122 123 124 125 126 127 128 129 130 131 132 133 134 135 136 137 138 139 140 141 142 143 144 145 146 147 148 149 150 151 152 153 154 155 156 157 158 159 160 161 162 163 164 165 166 167 168 169 170 171 172 173 174 175 176 177 178 179 180 181 182 183 184 185 186 187 188 189 190 191 192 193 194 195 196 197 198 199 200 201 202 203 204 205 206 207 208 209 210 211 212 213 214 215 216 217 218 219 220 221 222 223 224 225 226 227 228 229 230 231 232 233 234 235 236 237 238 239 240 241 242 243 244 245 246 247 248 249 250 251 252 253 254 255 256 257 258 259 260 261 262 263 264 265 266 267 268 269 270 271 272 273 274 275 276 277 278 279 280 281 282 283 284 285 286 287 288 289 290 291 292 293 294 295 296 297 298 299 300 301 302 303 304 305 306 307 308 309 310 311 312 313 314 315 316 317 318 319 320 321 322 323 324 325 326 327 328 329 330 331 332 333 334 335 336 337 338 339 340 341 342 343 344 345 346 347 348 349 350 351 352 353 354 355 356 357 358 359 360 361 362 363 364 365 366 367 368 369 370 371 372 373 374 375 376 377 378 379 380 381 382 383 384 385 386 387 388 389 390 391 392 393 394 395 396 397 398 399 400 401 402 403 404 405 406 407 408 409 410 411 412 413 414 415 416 417 418 419 420 421 422 423 424 425 426 427 428 429 430 431 432 433 434 435 436 437 438 |
//OHLC Y Q M W D H4 H1 Last Bar //Coded by Vonasi //20190415 defparam drawonlastbaronly = true //Settings //LookBack = 1 //Y = 0 //Q = 0 //M = 1 //W = 0 //D = 0 //H4 = 0 //H1 = 0 //OpenClose = 1 //HighLow = 1 //1 Hour if h1 then if openhour <> openhour[1] then h1index = h1index + 1 h1high = 0 h1low = close h1open = open h1close = close if h1index > lookback then for j = 1 to barindex if h1index[j] = h1index - lookback then myh1high = h1high[j] myh1low = h1low[j] myh1open = h1open[j] myh1close = h1close[j] break endif next endif endif h1high = max(h1high,high) h1low = min(h1low,low) h1close = close endif //4 Hour if h4 then if openhour <> openhour[1] and (openhour = 1 or openhour = 5 or openhour = 9 or openhour = 13 or openhour = 17 or openhour = 21) then h4index = h4index + 1 h4high = 0 h4low = close h4open = open h4close = close if h4index > lookback then for j = 1 to barindex if h4index[j] = h4index - lookback then myh4high = h4high[j] myh4low = h4low[j] myh4open = h4open[j] myh4close = h4close[j] break endif next endif endif h4high = max(h4high,high) h4low = min(h4low,low) h4close = close endif //Day if d then if openday <> openday[1] then dayindex = dayindex + 1 dayhigh = 0 daylow = close dayopen = open dayclose = close if dayindex > lookback then for j = 1 to barindex if dayindex[j] = dayindex - lookback then mydayhigh = dayhigh[j] mydaylow = daylow[j] mydayopen = dayopen[j] mydayclose = dayclose[j] break endif next endif endif dayhigh = max(dayhigh,high) daylow = min(daylow,low) dayclose = close endif //Week if w then if opendayofweek < opendayofweek[1] then weekindex = weekindex + 1 weekhigh = 0 weeklow = close weekopen = open weekclose = close if weekindex > lookback then for j = 1 to barindex if weekindex[j] = weekindex - lookback then myweekhigh = weekhigh[j] myweeklow = weeklow[j] myweekopen = weekopen[j] myweekclose = weekclose[j] break endif next endif endif weekhigh = max(weekhigh,high) weeklow = min(weeklow,low) weekclose = close endif //Month if m then if openmonth <> openmonth[1] then monthindex = monthindex + 1 monthhigh = 0 monthlow = close monthopen = open monthclose = close if monthindex > lookback then for j = 1 to barindex if monthindex[j] = monthindex - lookback then mymonthhigh = monthhigh[j] mymonthlow = monthlow[j] mymonthopen = monthopen[j] mymonthclose = monthclose[j] break endif next endif endif monthhigh = max(monthhigh,high) monthlow = min(monthlow,low) monthclose = close endif //Quarter if q then if openmonth <> openmonth[1] and (openmonth = 1 or openmonth = 4 or openmonth = 7 or openmonth = 10) then quarterindex = quarterindex + 1 quarterhigh = 0 quarterlow = close quarteropen = open quarterclose = close if quarterindex > lookback then for j = 1 to barindex if quarterindex[j] = quarterindex - lookback then myquarterhigh = quarterhigh[j] myquarterlow = quarterlow[j] myquarteropen = quarteropen[j] myquarterclose = quarterclose[j] break endif next endif endif quarterhigh = max(quarterhigh,high) quarterlow = min(quarterlow,low) quarterclose = close endif //Year if y then if openyear <> openyear[1] then yearindex = yearindex + 1 yearhigh = 0 yearlow = close yearopen = open yearclose = close if yearindex > lookback then for j = 1 to barindex if yearindex[j] = yearindex - lookback then myyearhigh = yearhigh[j] myyearlow = yearlow[j] myyearopen = yearopen[j] myyearclose = yearclose[j] break endif next endif endif yearhigh = max(yearhigh,high) yearlow = min(yearlow,low) yearclose = close endif //Remove zero value plotting at start and unwanted lines if h1index < lookback or not h1 or not openclose then myh1open = undefined myh1close = undefined endif if h1index < lookback or not h1 or not highlow then myh1high = undefined myh1low = undefined endif if h4index < lookback or not h4 or not openclose then myh4open = undefined myh4close = undefined endif if h4index < lookback or not h4 or not highlow then myh4high = undefined myh4low = undefined endif if dayindex < lookback or not d or not openclose then mydayopen = undefined mydayclose = undefined endif if dayindex < lookback or not d or not highlow then mydayhigh = undefined mydaylow = undefined endif if weekindex < lookback or not w or not openclose then myweekopen = undefined myweekclose = undefined endif if weekindex < lookback or not w or not highlow then myweekhigh = undefined myweeklow = undefined endif if monthindex < lookback or not m or not openclose then mymonthopen = undefined mymonthclose = undefined endif if monthindex < lookback or not m or not highlow then mymonthhigh = undefined mymonthlow = undefined endif if quarterindex < lookback or not q or not openclose then myquarteropen = undefined myquarterclose = undefined endif if quarterindex < lookback or not q or not highlow then myquarterhigh = undefined myquarterlow = undefined endif if yearindex < lookback or not y or not openclose then myyearopen = undefined myyearclose = undefined endif if yearindex < lookback or not y or not highlow then myyearhigh = undefined myyearlow = undefined endif if y and openclose then drawhline(myyearopen) coloured(100,149,237) drawhline(myyearclose) coloured(0,0,255) if not values then drawtext("[Y] #lookback#", barindex, myyearopen, SansSerif, standard, 10) coloured (100,149,237) drawtext("[Y] #lookback#", barindex, myyearclose, SansSerif, standard, 10) coloured (0,0,255) else drawtext("#myyearopen# [Y] #lookback#", barindex, myyearopen, SansSerif, standard, 10) coloured (100,149,237) drawtext("#myyearclose# [Y] #lookback#", barindex, myyearclose, SansSerif, standard, 10) coloured (0,0,255) endif endif if y and highlow then drawhline(myyearhigh) coloured(0,128,0) drawhline(myyearlow) coloured(128,0,0) if not values then drawtext("[Y] #lookback#", barindex, myyearhigh, SansSerif, standard, 10) coloured (0,128,0) drawtext("[Y] #lookback#", barindex, myyearlow, SansSerif, standard, 10) coloured (128,0,0) else drawtext("#myyearhigh# [Y] #lookback#", barindex, myyearhigh, SansSerif, standard, 10) coloured (0,128,0) drawtext("#myyearlow# [Y] #lookback#", barindex, myyearlow, SansSerif, standard, 10) coloured (128,0,0) endif endif if q and openclose then drawhline(myquarteropen) coloured(100,149,237) drawhline(myquarterclose) coloured(0,0,255) if not values then drawtext("[Q] #lookback#", barindex, myquarteropen, SansSerif, standard, 10) coloured (100,149,237) drawtext("[Q] #lookback#", barindex, myquarterclose, SansSerif, standard, 10) coloured (0,0,255) else drawtext("#myquarteropen# [Q] #lookback#", barindex, myquarteropen, SansSerif, standard, 10) coloured (100,149,237) drawtext("#myquarterclose# [Q] #lookback#", barindex, myquarterclose, SansSerif, standard, 10) coloured (0,0,255) endif endif if q and highlow then drawhline(myquarterhigh) coloured(0,128,0) drawhline(myquarterlow) coloured(128,0,0) if not values then drawtext("[Q] #lookback#", barindex, myquarterhigh, SansSerif, standard, 10) coloured (0,128,0) drawtext("[Q] #lookback#", barindex, myquarterlow, SansSerif, standard, 10) coloured (128,0,0) else drawtext("#myquarterhigh# [Q] #lookback#", barindex, myquarterhigh, SansSerif, standard, 10) coloured (0,128,0) drawtext("#myquarterlow# [Q] #lookback#", barindex, myquarterlow, SansSerif, standard, 10) coloured (128,0,0) endif endif if m and openclose then drawhline(mymonthopen) coloured(100,149,237) drawhline(mymonthclose) coloured(0,0,255) if not values then drawtext("[M] #lookback#", barindex, mymonthopen, SansSerif, standard, 10) coloured (100,149,237) drawtext("[M] #lookback#", barindex, mymonthclose, SansSerif, standard, 10) coloured (0,0,255) else drawtext("#mymonthopen# [M] #lookback#", barindex, mymonthopen, SansSerif, standard, 10) coloured (100,149,237) drawtext("#mymonthclose# [M] #lookback#", barindex, mymonthclose, SansSerif, standard, 10) coloured (0,0,255) endif endif if m and highlow then drawhline(mymonthhigh) coloured(0,128,0) drawhline(mymonthlow) coloured(128,0,0) if not values then drawtext("[M] #lookback#", barindex, mymonthhigh, SansSerif, standard, 10) coloured (0,128,0) drawtext("[M] #lookback#", barindex, mymonthlow, SansSerif, standard, 10) coloured (128,0,0) else drawtext("#mymonthhigh# [M] #lookback#", barindex, mymonthhigh, SansSerif, standard, 10) coloured (0,128,0) drawtext("#mymonthlow# [M] #lookback#", barindex, mymonthlow, SansSerif, standard, 10) coloured (128,0,0) endif endif if w and openclose then drawhline(myweekopen) coloured(100,149,237) drawhline(myweekclose) coloured(0,0,255) if not values then drawtext("[W] #lookback#", barindex, myweekopen, SansSerif, standard, 10) coloured (100,149,237) drawtext("[W] #lookback#", barindex, myweekclose, SansSerif, standard, 10) coloured (0,0,255) else drawtext("#myweekopen# [W] #lookback#", barindex, myweekopen, SansSerif, standard, 10) coloured (100,149,237) drawtext("#myweekclose# [W] #lookback#", barindex, myweekclose, SansSerif, standard, 10) coloured (0,0,255) endif endif if w and highlow then drawhline(myweekhigh) coloured(0,128,0) drawhline(myweeklow) coloured(128,0,0) if not values then drawtext("[W] #lookback#", barindex, myweekhigh, SansSerif, standard, 10) coloured (0,128,0) drawtext("[W] #lookback#", barindex, myweeklow, SansSerif, standard, 10) coloured (128,0,0) else drawtext("#myweekhigh# [W] #lookback#", barindex, myweekhigh, SansSerif, standard, 10) coloured (0,128,0) drawtext("#myweeklow# [W] #lookback#", barindex, myweeklow, SansSerif, standard, 10) coloured (128,0,0) endif endif if d and openclose then drawhline(mydayopen) coloured(100,149,237) drawhline(mydayclose) coloured(0,0,255) if not values then drawtext("[D] #lookback#", barindex, mydayopen, SansSerif, standard, 10) coloured (100,149,237) drawtext("[D] #lookback#", barindex, mydayclose, SansSerif, standard, 10) coloured (0,0,255) else drawtext("#mydayopen# [D] #lookback#", barindex, mydayopen, SansSerif, standard, 10) coloured (100,149,237) drawtext("#mydayclose# [D] #lookback#", barindex, mydayclose, SansSerif, standard, 10) coloured (0,0,255) endif endif if d and highlow then drawhline(mydayhigh) coloured(0,128,0) drawhline(mydaylow) coloured(128,0,0) if not values then drawtext("[D] #lookback#", barindex, mydayhigh, SansSerif, standard, 10) coloured (0,128,0) drawtext("[D] #lookback#", barindex, mydaylow, SansSerif, standard, 10) coloured (128,0,0) else drawtext("#mydayhigh# [D] #lookback#", barindex, mydayhigh, SansSerif, standard, 10) coloured (0,128,0) drawtext("#mydaylow# [D] #lookback#", barindex, mydaylow, SansSerif, standard, 10) coloured (128,0,0) endif endif if h4 and openclose then drawhline(myh4open) coloured(100,149,237) drawhline(myh4close) coloured(0,0,255) if not values then drawtext("[H4] #lookback#", barindex, myh4open, SansSerif, standard, 10) coloured (100,149,237) drawtext("[H4] #lookback#", barindex, myh4close, SansSerif, standard, 10) coloured (0,0,255) else drawtext("#myh4open# [H4] #lookback#", barindex, myh4open, SansSerif, standard, 10) coloured (100,149,237) drawtext("#myh4close# [H4] #lookback#", barindex, myh4close, SansSerif, standard, 10) coloured (0,0,255) endif endif if h4 and highlow then drawhline(myh4high) coloured(0,128,0) drawhline(myh4low) coloured(128,0,0) if not values then drawtext("[H4] #lookback#", barindex, myh4high, SansSerif, standard, 10) coloured (0,128,0) drawtext("[H4] #lookback#", barindex, myh4low, SansSerif, standard, 10) coloured (128,0,0) else drawtext("#myh4high# [H4] #lookback#", barindex, myh4high, SansSerif, standard, 10) coloured (0,128,0) drawtext("#myh4low# [H4] #lookback#", barindex, myh4low, SansSerif, standard, 10) coloured (128,0,0) endif endif if h1 and openclose then drawhline(myh1open) coloured(100,149,237) drawhline(myh1close) coloured(0,0,255) if not values then drawtext("[H1] #lookback#", barindex, myh1open, SansSerif, standard, 10) coloured (100,149,237) drawtext("[H1] #lookback#", barindex, myh1close, SansSerif, standard, 10) coloured (0,0,255) else drawtext("#myh1open# [H1] #lookback#", barindex, myh1open, SansSerif, standard, 10) coloured (100,149,237) drawtext("#myh1close# [H1] #lookback#", barindex, myh1close, SansSerif, standard, 10) coloured (0,0,255) endif endif if h1 and highlow then drawhline(myh1high) coloured(0,128,0) drawhline(myh1low) coloured(128,0,0) if not values then drawtext("[H1] #lookback#", barindex, myh1high, SansSerif, standard, 10) coloured (0,128,0) drawtext("[H1] #lookback#", barindex, myh1low, SansSerif, standard, 10) coloured (128,0,0) else drawtext("#myh1high# [H1] #lookback#", barindex, myh1high, SansSerif, standard, 10) coloured (0,128,0) drawtext("#myh1low# [H1] #lookback#", barindex, myh1low, SansSerif, standard, 10) coloured (128,0,0) endif endif return |
Share this
No information on this site is investment advice or a solicitation to buy or sell any financial instrument. Past performance is not indicative of future results. Trading may expose you to risk of loss greater than your deposits and is only suitable for experienced investors who have sufficient financial means to bear such risk.
ProRealTime ITF files and other attachments :
Find other exclusive trading pro-tools on ![]()
PRC is also on YouTube, subscribe to our channel for exclusive content and tutorials


Change line 76 to if opendayofweek opendayofweek[1] and opendayofweek 0 then if you want Sunday data to be included with Friday data. This avoids Monday the lines being based on the normally small Sunday candle OHLC.
I just noticed that the above post makes no sense as the symbols have been removed. Here in English is what the conditions should be: IF opendayofweek is different to opendayofweek[1] AND opendayofweek is different to 0 THEN
Hi Vonasi,
Hope you are well.
Above coding all works fine but on 4hr chart, 4hr lines don’t work.. this is only the 4hr chart.. any reason for that??
It is a long time since I coded this. You may have found a coding error. At a glance I think the OPENHOUR settings might be wrong in line 48. Try changing OPENHOUR to HOUR and if that does not work I will check it tomorrow.
Yes that was the issue. I have posted an updated ITF file here: https://www.prorealcode.com/topic/ohlc-y-m-w-d-h4-h1-last-bar-indicator-minor-fix/
@vonasi Thank you for fixing the issue! This is a great indicator.
good evening vonasi , I had made the request to create this indicator a few years ago and I gave up because I did not have the level nevertheless I use it since and I would like to take advantage of it. j would like to change the top preceding above higherhigh[1] and precede low by preceding lower lowerlow[1] on all ut !…it’s much more efficient… I do not use the 4H and 1H but instead I would like the 15MN and in the end we added little yh-yl,qh-ql,th-tl,mh-ml,dh-dl,15h-15l, it is better on the graph for colors if you could set them without entering the code as everyone does what he wants, I have an option to trace fibo that I little activated or not , I personally do not use it, on the other hand can we added a signal like an arrow when the candle closes above or below the set up 15 minutes?, and finally if you want to complete this indicator a scrrenner on the same basis having the choice of research C would be very effective.you do great work I would like to have your level for code that I like , I continue to learn every day thanks to the forum member… Thank you…