Pivot Support/Resistance Zones

v10.3
Pivot Support/Resistance Zones

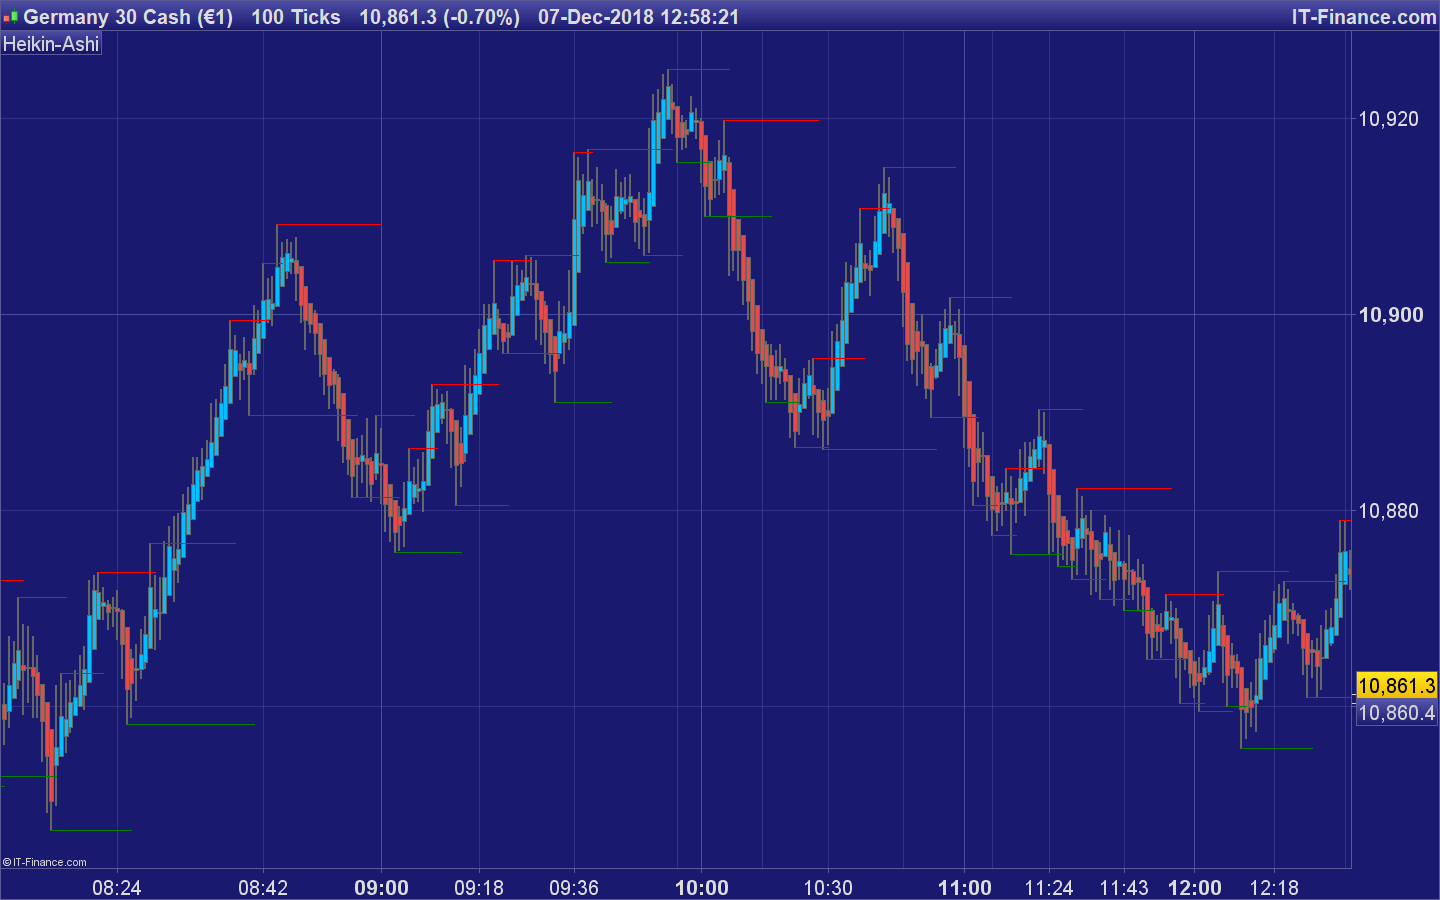
This indicator plots levels of support/resistance calculated with high/low pivot points:

At a price bar preceded by 4 higher lows and followed by 2 higher lows, a new support line is found and green line is starting. It starts at the lowest low and stops until the line is later crossed or when a new support is formed later.

The same for a red resistance line at a price bar with 4 lower Highs before and followed by 2 lower Highs.

The code has been made following a request in the ProBuilder forum.


Share this

Risk disclosure:

No information on this site is investment advice or a solicitation to buy or sell any financial instrument. Past performance is not indicative of future results. Trading may expose you to risk of loss greater than your deposits and is only suitable for experienced investors who have sufficient financial means to bear such risk.

ProRealTime ITF files and other attachments : How to import ITF files into ProRealTime platform?

PRC is also on YouTube, subscribe to our channel for exclusive content and tutorials

  1. rama • 12/07/2018 #

    This is one of best indicator to trade any time frame

  2. Madrosat • 12/07/2018 #

    Is this indicator as it is , useful in strategy automatic

  3. Vangotten • 12/07/2018 #

    Muy buen indicador

  4. s00071609 • 12/07/2018 #

    Hi Roberto
    I am trying to use this indicator but once i import the itf file. the indicator gets imported but when i apply it to chart – it does not plot to the price chart rather it takes the space under the chart like Oscillators.
    Could you please suggest what I am doing wrong.

    • robertogozzi • 12/07/2018 #

      Click the wrench on the upper left corner of your chart, then select PRIICE on the left and click ADD INDICATOR and then again select the indicator of your choice.

  5. s00071609 • 12/07/2018 #

    thanks now its working

  6. s00071609 • 12/07/2018 #

    How would it be possible to call the Last Support Price and the Resistance Price from strategy?

    • robertogozzi • 12/07/2018 #

      Replace RETURN with RETURN SupportPrice,ResistancePrice.
      When you CALL they will be returned in the same order you have written them next to RETURN, as you can easilysee from documentation and the many indicators and code snippets on these forums.

  7. s00071609 • 12/07/2018 #

    Great thank you

  8. Bard • 12/07/2018 #

    Thanks for this great indicator @Robertogozzi, I wondered if it was possible to make an exponential average band version? I tried to make 2 period EMA’s of the SupportPrice and ResistancePrice which almost works except for the bands lag behind the high resistance and low support areas. Cheers.

    • robertogozzi • 12/07/2018 #

      You can find it at https://www.prorealcode.com/topic/pivot-support-resistance-bands/.
      I hope it’s what you wanted.

    • Bard • 12/07/2018 #

      Yes, thanks, appreciated.

  9. mscharstrom • 12/07/2018 #

    Hi @robertogozzi,

    I really love this indicator. However, I’d like to tinker with it to fit my needs a bit better.
    I am new to ProRealCode (and ProRealTime) in general, hence I’m having some issues getting it to where I want.

    Please see this image:
    https://imgur.com/a/Lwk2nvS

    Would it be possible to alter the code so that it would draw rectangles as my image? Only on new highest high and lowest low. Potentially merging if two lines are “close” to each other. In the image attached, one example would be 1531 to 1527 (since 1531 and 1531 are so close to each other).

    I love drawing out resistance/support levels like this, but it would of course save me lots of time if it could be done automatically. Would appreciate your input greatly and if you could point me in any direction.

    In the best of worlds, I would later add so that it could draw boxes based on consolidation some patterns.

    Kindest regards

  10. Ahimsa • 12/07/2018 #

    Hi Roberto

    I cannot thank you enough for writing this code. It could help me more than you know.

    I have the same problem as another poster though in that I can’t add it to the chart. It comes up as an oscillator below the price chart. I don’t even appear to have a ‘wrench’ in the top left corner in order to sort this out.

    Best wishes Ahimsa

    • Nicolas • 12/07/2018 #

      With PRT v11, you have to click on “price” at the upper left side of the price chart.

avatar
Register or

Likes

avatar avatar avatar avatar avatar avatar avatar avatar avatar avatar avatar avatar avatar avatar avatar avatar

+15 more likes

Related users ' posts
P. Marlowe Impressive work. Accurate, interesting, good background. You hit the nail on the head again....
14starwberryhill Such a wonderful work, thanks Ivan..............
Iván Hi You should delete from the indicator code all drawing functions and all variables not us...
Iván I've created a screener to show [longcondition or shortcondition]
Chrisinobi Hallo Ivan, Danke das ist Perfekt !! Kannst du bitte in der Screener-Bibliothek die itf. hoc...
Nicolas
11 months ago
Maxime Baudin Well done Nicolas, creative!
Stenozar Hi Nicolas, please can you explain how to read/use this indicator? thanks!
cdc.andersson Hej! Jag försöker lära mig att koda PRT. Jag vill testa en strategi med RSI-värde, ATR-värde...
Swingforfortune Du kan väl jämföra om open > close (röd) eller open < close (grön)
Guibourse Hi, I'd like to increase the thickness of support and resistance lines. I do not think that ...
JJ Tec Hello. Thanks for the great contribution of the indicator. At the moment, I have modified i...
Khaled Hi Vonasi, I tried to embed your PP Fractals code in a Strategy and it seems to be a good fi...
fazel53 How do i attach this indicator to my mt5 platform?
Nicolas You can't! All indicators here are for ProRealTime trading platform: https://www.prorealtime...
mistersylv What parameter should we change to make another channel appear in the higher or lower time u...
Nicolas Oui le code est correct et il fonctionne, j'ai de bons résultats sur la liste NASDAQ par exe...
pincherman Bonjour :-) J'ai coller le script dans prorealtime pour jouer avec le supertrend et j'ai un...
Nicolas Vous l'avez sans doute collé au mauvais endroit, dans l'éditeur de code pour les stratégies,...
Vonasi There are actually two ways to calculate standard deviations and I seem to have used the ver...
Rory Dryden Thank you. Experimenting with it now.
Wolf Hi Vonasi. Thank for this indicator. I like this calculate concept. I think that line 16 thi...
Vonasi Well spotted! It is just a safety check to ensure that no value below 1 can be used otherwis...
Reddington Hi Vonasi! Really nice work, is it possible to re-create this to work in 10.3? Best regards ...
Vonasi Thanks for the compliments. No this is not easily possible in v10.3 because it uses arrays w...
bruces Hi and thank you. I successfully imported original version above and added to my Prorealtim...
carpentier Joffrey Bonjour à tous, Avant tout merci pour ce travail, cependant je suis bloqué quand je l'insta...
carpentier Joffrey Re, C'est ok, j'ai trouvé mon erreur... Cependant sur quel base peut on calculer son CALC...
Aragorna Hi Nicolas, How is it possible to use it in a higher timeframe plotted on a lower timeframe?...
Bhanu Pratap Great Work Sir, Hats Off.
bolsatonimora2 Hi Roberto, It is possible to modify this indicator which it marks the supports and resist...
robertogozzi What do you mean by "very high volume"? What do you want to be printed exactly?
Bard Very interesting approach Vonasi! I'm getting a 404 error when trying to download though?
Vonasi I just tested and I was able to download with no error.
Psari Hi Vonasi, I am a newbie and was wondering whether you could possibly help me with this pro...
Vonasi Yes that was the issue. I have posted an updated ITF file here: https://www.prorealcode.com/...
crolakstrading @vonasi Thank you for fixing the issue! This is a great indicator.
gregoire good evening vonasi , I had made the request to create this indicator a few years ago and I ...
Giogio hello dear Vonasi, thank you for your indicator, can I ask you for some help in order to let...
Pottar24 HI Vonasi I would like to know how can this algorithm give me the value of the last max e mi...
parthapersonal Hello Vonasi, Great work. Is it possible to replicate this to get values of "Price Line" (1...
tobytarczy Hi Vonasi, Sounds lovely, I race yachts around europe myself. Most regattas cancelled unfor...
mlouys Hello Vonasi thank for your work ! A question how can we do it for minutes ( or 15 min or x ...
Vonasi I think that would be possible but probably in a whole new indicator as detecting when a new...

Top