

Yearly Quarterly Monthly Weekly Daily H4 H1 OHLC Lines - Last Bar Only Version
This is an alternative version of the ‘Yearly Quarterly Monthly Weekly Daily H4 H1 OHLC Lines’ indicator that can be found here:
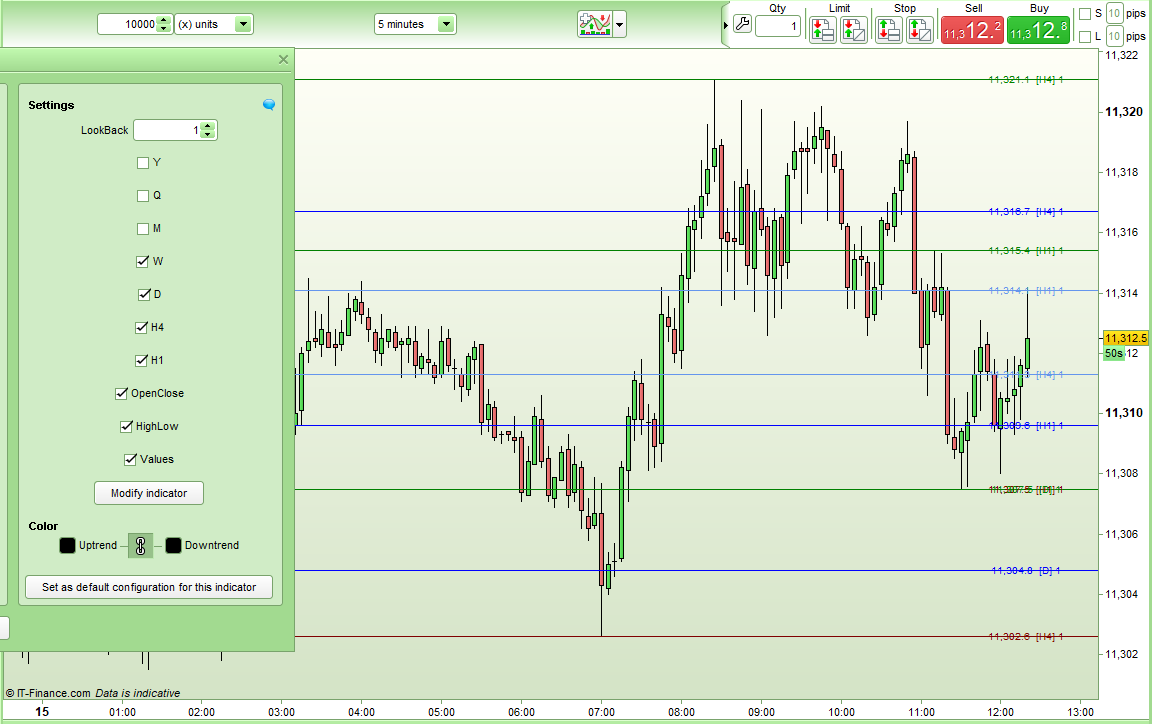
This version only draws the latest open, high, low and close lines and labels them so that you know which period they are drawn from and what price they are at.
As with the first version you can turn off any periods that you don’t want to see. You can also select whether you see just open and close lines or just high and low lines or all of them. You can also turn off the displayed price by using the ‘Values’ setting.
As with the first version you can set a look back period so that you can see the OHLC from any period. So you can plot lines from 2 months ago or 2 days ago or 3 weeks ago etc. By applying the indicator multiple times to a chart with different look back settings you can have for example the OHLC values from the last three months on the chart.
All lines are labelled with price first followed by the period in [ ] and then the look back period. The lines are colour coded as follows:
- Open = light blue
- High = green
- Low = red
- Close = dark blue
So for example:
- 1029.5 [D] 2 in green = the high from 2 days ago which was at a price of 1029.5
- 1054.2 [H1] 1 in red = the low from the last hour which was at a price of 1054.2
This indicator can be used to recognize possible support and resistance levels and for breakout trading.
I recommend using this indicator alongside my ‘Last Two Highest High and Lowest Low as Horizontal Lines – Yearly Quarterly, Monthly, Weekly, Daily, 4 Hour and 1 Hour’ indicator. This will give you lines representing the extension of connecting the last two highs and last two lows of each period. The two indicators plotted on the same chart can show you levels that others may be looking at. The labels in this indicator are not in [ ] so you can know whether you are looking at a horizontal OHLC line or the extension of a line connecting highs or lows when both indicators are on the same chart. That indicator can be found here:
I advise downloading and importing the ITF file to get full functionality.
//OHLC Y Q M W D H4 H1 Last Bar
//Coded by Vonasi
//20190415

defparam drawonlastbaronly = true
//Settings

//LookBack = 1
//Y = 0
//Q = 0
//M = 1
//W = 0
//D = 0
//H4 = 0
//H1 = 0
//OpenClose = 1
//HighLow = 1

//1 Hour
if h1 then
if openhour <> openhour[1] then
h1index = h1index + 1
h1high = 0
h1low = close
h1open = open
h1close = close

if h1index > lookback then
for j = 1 to barindex
if h1index[j] = h1index - lookback then
myh1high = h1high[j]
myh1low = h1low[j]
myh1open = h1open[j]
myh1close = h1close[j]
break
endif
next
endif
endif

h1high = max(h1high,high)
h1low = min(h1low,low)
h1close = close
endif

//4 Hour
if h4 then
if openhour <> openhour[1] and (openhour = 1 or openhour = 5 or openhour = 9 or openhour = 13 or openhour = 17 or openhour = 21) then
h4index = h4index + 1
h4high = 0
h4low = close
h4open = open
h4close = close

if h4index > lookback then
for j = 1 to barindex
if h4index[j] = h4index - lookback then
myh4high = h4high[j]
myh4low = h4low[j]
myh4open = h4open[j]
myh4close = h4close[j]
break
endif
next
endif
endif

h4high = max(h4high,high)
h4low = min(h4low,low)
h4close = close
endif


//Day
if d then
if openday <> openday[1] then
dayindex = dayindex + 1
dayhigh = 0
daylow = close
dayopen = open
dayclose = close

if dayindex > lookback then
for j = 1 to barindex
if dayindex[j] = dayindex - lookback then
mydayhigh = dayhigh[j]
mydaylow = daylow[j]
mydayopen = dayopen[j]
mydayclose = dayclose[j]
break
endif
next
endif
endif

dayhigh = max(dayhigh,high)
daylow = min(daylow,low)
dayclose = close
endif


//Week
if w then
if opendayofweek < opendayofweek[1] then
weekindex = weekindex + 1
weekhigh = 0
weeklow = close
weekopen = open
weekclose = close

if weekindex > lookback then
for j = 1 to barindex
if weekindex[j] = weekindex - lookback then
myweekhigh = weekhigh[j]
myweeklow = weeklow[j]
myweekopen = weekopen[j]
myweekclose = weekclose[j]
break
endif
next
endif
endif

weekhigh = max(weekhigh,high)
weeklow = min(weeklow,low)
weekclose = close
endif


//Month
if m then
if openmonth <> openmonth[1] then
monthindex = monthindex + 1
monthhigh = 0
monthlow = close
monthopen = open
monthclose = close

if monthindex > lookback then
for j = 1 to barindex
if monthindex[j] = monthindex - lookback then
mymonthhigh = monthhigh[j]
mymonthlow = monthlow[j]
mymonthopen = monthopen[j]
mymonthclose = monthclose[j]
break
endif
next
endif
endif

monthhigh = max(monthhigh,high)
monthlow = min(monthlow,low)
monthclose = close
endif


//Quarter
if q then
if openmonth <> openmonth[1] and (openmonth = 1 or openmonth = 4 or openmonth = 7 or openmonth = 10) then
quarterindex = quarterindex + 1
quarterhigh = 0
quarterlow = close
quarteropen = open
quarterclose = close

if quarterindex > lookback then
for j = 1 to barindex
if quarterindex[j] = quarterindex - lookback then
myquarterhigh = quarterhigh[j]
myquarterlow = quarterlow[j]
myquarteropen = quarteropen[j]
myquarterclose = quarterclose[j]
break
endif
next
endif
endif

quarterhigh = max(quarterhigh,high)
quarterlow = min(quarterlow,low)
quarterclose = close
endif


//Year
if y then
if openyear <> openyear[1] then
yearindex = yearindex + 1
yearhigh = 0
yearlow = close
yearopen = open
yearclose = close

if yearindex > lookback then
for j = 1 to barindex
if yearindex[j] = yearindex - lookback then
myyearhigh = yearhigh[j]
myyearlow = yearlow[j]
myyearopen = yearopen[j]
myyearclose = yearclose[j]
break
endif
next
endif
endif

yearhigh = max(yearhigh,high)
yearlow = min(yearlow,low)
yearclose = close
endif

//Remove zero value plotting at start and unwanted lines
if h1index < lookback or not h1 or not openclose then
myh1open = undefined
myh1close = undefined
endif
if h1index < lookback or not h1 or not highlow then
myh1high = undefined
myh1low = undefined
endif

if h4index < lookback or not h4 or not openclose then
myh4open = undefined
myh4close = undefined
endif
if h4index < lookback or not h4 or not highlow then
myh4high = undefined
myh4low = undefined
endif

if dayindex < lookback or not d or not openclose then
mydayopen = undefined
mydayclose = undefined
endif
if dayindex < lookback or not d or not highlow then
mydayhigh = undefined
mydaylow = undefined
endif

if weekindex < lookback or not w or not openclose then
myweekopen = undefined
myweekclose = undefined
endif
if weekindex < lookback or not w or not highlow then
myweekhigh = undefined
myweeklow = undefined
endif

if monthindex < lookback or not m or not openclose then
mymonthopen = undefined
mymonthclose = undefined
endif
if monthindex < lookback or not m or not highlow then
mymonthhigh = undefined
mymonthlow = undefined
endif

if quarterindex < lookback or not q or not openclose then
myquarteropen = undefined
myquarterclose = undefined
endif
if quarterindex < lookback or not q or not highlow then
myquarterhigh = undefined
myquarterlow = undefined
endif

if yearindex < lookback or not y or not openclose then
myyearopen = undefined
myyearclose = undefined
endif
if yearindex < lookback or not y or not highlow then
myyearhigh = undefined
myyearlow = undefined
endif

if y and openclose then
drawhline(myyearopen) coloured(100,149,237)
drawhline(myyearclose) coloured(0,0,255)
if not values then
drawtext("[Y] #lookback#", barindex, myyearopen, SansSerif, standard, 10) coloured (100,149,237)
drawtext("[Y] #lookback#", barindex, myyearclose, SansSerif, standard, 10) coloured (0,0,255)
else
drawtext("#myyearopen# [Y] #lookback#", barindex, myyearopen, SansSerif, standard, 10) coloured (100,149,237)
drawtext("#myyearclose# [Y] #lookback#", barindex, myyearclose, SansSerif, standard, 10) coloured (0,0,255)
endif
endif
if y and highlow then
drawhline(myyearhigh) coloured(0,128,0)
drawhline(myyearlow) coloured(128,0,0)
if not values then
drawtext("[Y] #lookback#", barindex, myyearhigh, SansSerif, standard, 10) coloured (0,128,0)
drawtext("[Y] #lookback#", barindex, myyearlow, SansSerif, standard, 10) coloured (128,0,0)
else
drawtext("#myyearhigh# [Y] #lookback#", barindex, myyearhigh, SansSerif, standard, 10) coloured (0,128,0)
drawtext("#myyearlow# [Y] #lookback#", barindex, myyearlow, SansSerif, standard, 10) coloured (128,0,0)
endif
endif

if q and openclose then
drawhline(myquarteropen) coloured(100,149,237)
drawhline(myquarterclose) coloured(0,0,255)
if not values then
drawtext("[Q] #lookback#", barindex, myquarteropen, SansSerif, standard, 10) coloured (100,149,237)
drawtext("[Q] #lookback#", barindex, myquarterclose, SansSerif, standard, 10) coloured (0,0,255)
else
drawtext("#myquarteropen# [Q] #lookback#", barindex, myquarteropen, SansSerif, standard, 10) coloured (100,149,237)
drawtext("#myquarterclose# [Q] #lookback#", barindex, myquarterclose, SansSerif, standard, 10) coloured (0,0,255)
endif
endif
if q and highlow then
drawhline(myquarterhigh) coloured(0,128,0)
drawhline(myquarterlow) coloured(128,0,0)
if not values then
drawtext("[Q] #lookback#", barindex, myquarterhigh, SansSerif, standard, 10) coloured (0,128,0)
drawtext("[Q] #lookback#", barindex, myquarterlow, SansSerif, standard, 10) coloured (128,0,0)
else
drawtext("#myquarterhigh# [Q] #lookback#", barindex, myquarterhigh, SansSerif, standard, 10) coloured (0,128,0)
drawtext("#myquarterlow# [Q] #lookback#", barindex, myquarterlow, SansSerif, standard, 10) coloured (128,0,0)
endif
endif

if m and openclose then
drawhline(mymonthopen) coloured(100,149,237)
drawhline(mymonthclose) coloured(0,0,255)
if not values then
drawtext("[M] #lookback#", barindex, mymonthopen, SansSerif, standard, 10) coloured (100,149,237)
drawtext("[M] #lookback#", barindex, mymonthclose, SansSerif, standard, 10) coloured (0,0,255)
else
drawtext("#mymonthopen# [M] #lookback#", barindex, mymonthopen, SansSerif, standard, 10) coloured (100,149,237)
drawtext("#mymonthclose# [M] #lookback#", barindex, mymonthclose, SansSerif, standard, 10) coloured (0,0,255)
endif
endif
if m and highlow then
drawhline(mymonthhigh) coloured(0,128,0)
drawhline(mymonthlow) coloured(128,0,0)
if not values then
drawtext("[M] #lookback#", barindex, mymonthhigh, SansSerif, standard, 10) coloured (0,128,0)
drawtext("[M] #lookback#", barindex, mymonthlow, SansSerif, standard, 10) coloured (128,0,0)
else
drawtext("#mymonthhigh# [M] #lookback#", barindex, mymonthhigh, SansSerif, standard, 10) coloured (0,128,0)
drawtext("#mymonthlow# [M] #lookback#", barindex, mymonthlow, SansSerif, standard, 10) coloured (128,0,0)
endif
endif

if w and openclose then
drawhline(myweekopen) coloured(100,149,237)
drawhline(myweekclose) coloured(0,0,255)
if not values then
drawtext("[W] #lookback#", barindex, myweekopen, SansSerif, standard, 10) coloured (100,149,237)
drawtext("[W] #lookback#", barindex, myweekclose, SansSerif, standard, 10) coloured (0,0,255)
else
drawtext("#myweekopen# [W] #lookback#", barindex, myweekopen, SansSerif, standard, 10) coloured (100,149,237)
drawtext("#myweekclose# [W] #lookback#", barindex, myweekclose, SansSerif, standard, 10) coloured (0,0,255)
endif
endif
if w and highlow then
drawhline(myweekhigh) coloured(0,128,0)
drawhline(myweeklow) coloured(128,0,0)
if not values then
drawtext("[W] #lookback#", barindex, myweekhigh, SansSerif, standard, 10) coloured (0,128,0)
drawtext("[W] #lookback#", barindex, myweeklow, SansSerif, standard, 10) coloured (128,0,0)
else
drawtext("#myweekhigh# [W] #lookback#", barindex, myweekhigh, SansSerif, standard, 10) coloured (0,128,0)
drawtext("#myweeklow# [W] #lookback#", barindex, myweeklow, SansSerif, standard, 10) coloured (128,0,0)
endif
endif

if d and openclose then
drawhline(mydayopen) coloured(100,149,237)
drawhline(mydayclose) coloured(0,0,255)
if not values then
drawtext("[D] #lookback#", barindex, mydayopen, SansSerif, standard, 10) coloured (100,149,237)
drawtext("[D] #lookback#", barindex, mydayclose, SansSerif, standard, 10) coloured (0,0,255)
else
drawtext("#mydayopen# [D] #lookback#", barindex, mydayopen, SansSerif, standard, 10) coloured (100,149,237)
drawtext("#mydayclose# [D] #lookback#", barindex, mydayclose, SansSerif, standard, 10) coloured (0,0,255)
endif
endif
if d and highlow then
drawhline(mydayhigh) coloured(0,128,0)
drawhline(mydaylow) coloured(128,0,0)
if not values then
drawtext("[D] #lookback#", barindex, mydayhigh, SansSerif, standard, 10) coloured (0,128,0)
drawtext("[D] #lookback#", barindex, mydaylow, SansSerif, standard, 10) coloured (128,0,0)
else
drawtext("#mydayhigh# [D] #lookback#", barindex, mydayhigh, SansSerif, standard, 10) coloured (0,128,0)
drawtext("#mydaylow# [D] #lookback#", barindex, mydaylow, SansSerif, standard, 10) coloured (128,0,0)
endif
endif

if h4 and openclose then
drawhline(myh4open) coloured(100,149,237)
drawhline(myh4close) coloured(0,0,255)
if not values then
drawtext("[H4] #lookback#", barindex, myh4open, SansSerif, standard, 10) coloured (100,149,237)
drawtext("[H4] #lookback#", barindex, myh4close, SansSerif, standard, 10) coloured (0,0,255)
else
drawtext("#myh4open# [H4] #lookback#", barindex, myh4open, SansSerif, standard, 10) coloured (100,149,237)
drawtext("#myh4close# [H4] #lookback#", barindex, myh4close, SansSerif, standard, 10) coloured (0,0,255)
endif
endif
if h4 and highlow then
drawhline(myh4high) coloured(0,128,0)
drawhline(myh4low) coloured(128,0,0)
if not values then
drawtext("[H4] #lookback#", barindex, myh4high, SansSerif, standard, 10) coloured (0,128,0)
drawtext("[H4] #lookback#", barindex, myh4low, SansSerif, standard, 10) coloured (128,0,0)
else
drawtext("#myh4high# [H4] #lookback#", barindex, myh4high, SansSerif, standard, 10) coloured (0,128,0)
drawtext("#myh4low# [H4] #lookback#", barindex, myh4low, SansSerif, standard, 10) coloured (128,0,0)
endif
endif

if h1 and openclose then
drawhline(myh1open) coloured(100,149,237)
drawhline(myh1close) coloured(0,0,255)
if not values then
drawtext("[H1] #lookback#", barindex, myh1open, SansSerif, standard, 10) coloured (100,149,237)
drawtext("[H1] #lookback#", barindex, myh1close, SansSerif, standard, 10) coloured (0,0,255)
else
drawtext("#myh1open# [H1] #lookback#", barindex, myh1open, SansSerif, standard, 10) coloured (100,149,237)
drawtext("#myh1close# [H1] #lookback#", barindex, myh1close, SansSerif, standard, 10) coloured (0,0,255)
endif
endif
if h1 and highlow then
drawhline(myh1high) coloured(0,128,0)
drawhline(myh1low) coloured(128,0,0)
if not values then
drawtext("[H1] #lookback#", barindex, myh1high, SansSerif, standard, 10) coloured (0,128,0)
drawtext("[H1] #lookback#", barindex, myh1low, SansSerif, standard, 10) coloured (128,0,0)
else
drawtext("#myh1high# [H1] #lookback#", barindex, myh1high, SansSerif, standard, 10) coloured (0,128,0)
drawtext("#myh1low# [H1] #lookback#", barindex, myh1low, SansSerif, standard, 10) coloured (128,0,0)
endif
endif

return