Volume Accumulation Percentage Indicator

v10.3
Volume Accumulation Percentage Indicator

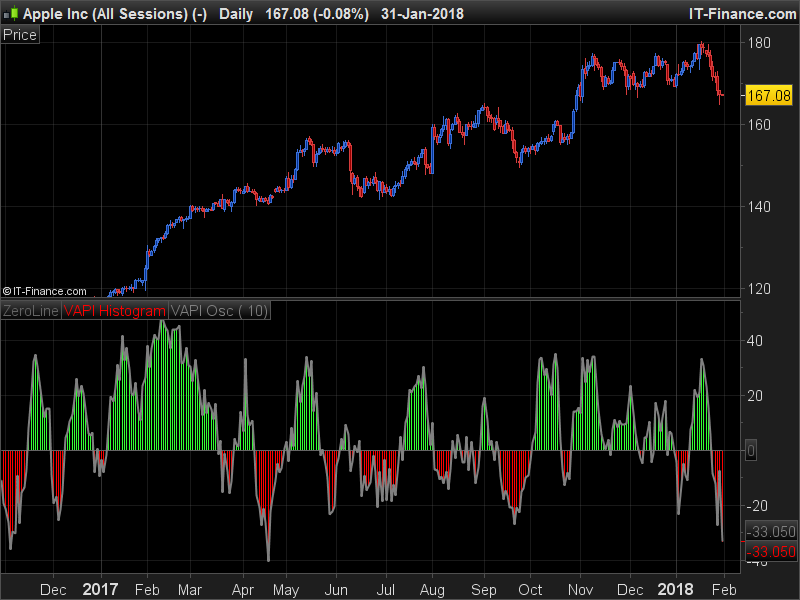
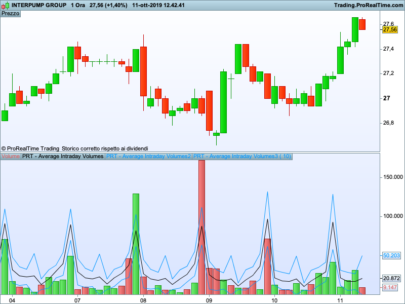
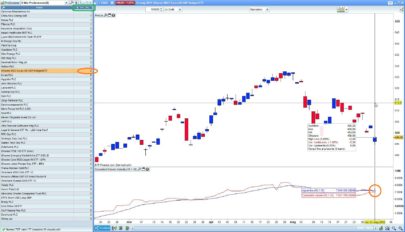
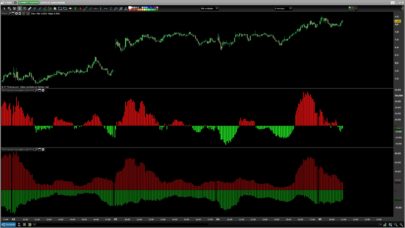
Volume Accumulation Percentage Indicator (VAPI) is a variation of the classic volume-accumulation indicators. It uses volume the same way as OBV except that it assigns volume weights based on intraday volatility . 

In a positive trend, if the stock price is close to a (local) new high, the VAPI should be at its maximum as well (and vice versa for a negative trend). If the market is looking for a direction, if the price is in the bottom side of his current trading range and if, at the same moment the VAPI osc slopes up, there is accumulation on the stock and that the prices should start to climb. The SELL signal is given when the VAPI decreases (distribution). Divergences are usually very effective too. 

(description from its original author LazyBear, code original from tradingview platform).

Translated by a request in the Italian ProRealTime’s indicators section.


Share this

Risk disclosure:

No information on this site is investment advice or a solicitation to buy or sell any financial instrument. Past performance is not indicative of future results. Trading may expose you to risk of loss greater than your deposits and is only suitable for experienced investors who have sufficient financial means to bear such risk.

ProRealTime ITF files and other attachments : How to import ITF files into ProRealTime platform?

PRC is also on YouTube, subscribe to our channel for exclusive content and tutorials

  1. Tonicejudo • 01/31/2018 #

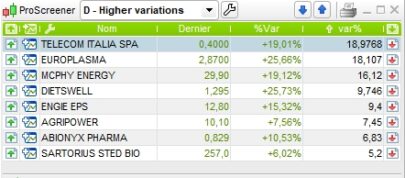
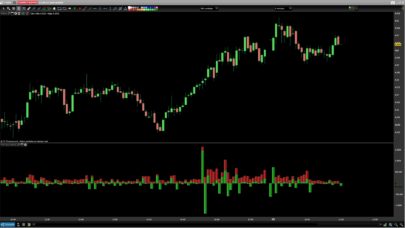
    Hola Nicolas, a ver si me puedes ayudar. Hay un indicador que se llama volumen stop de bolsatrilera que esta aqui en prorealcode.Este indicador da buenas señales.El indicador pinta la vela en azul cuando es alcista y en negro cuando es bajista.Yo necesitaria un proescreener que detecte las acciones que han pintado la vela azul, alcista.Gracias de antemano y un saludo.

    • Nicolas • 01/31/2018 #

      Utilice los foros para hacer preguntas no relacionadas con la página actual …

avatar
Register or

Likes

avatar avatar avatar avatar avatar avatar avatar avatar avatar
Related users ' posts
kal Buenos días TACBOLSA. Estoy muy interesado en ver tu blog para ver la explicación con detall...
1Randy I would be interested an invite to your blog. I am still learning about the VSA and it looks...
repropel Buenos días TACBOLSA. Yo también estoy interesado en visitar tu blog. Podrías enviarme una i...
Maxime Baudin Very useful! Thanks Mat, and Happy New Year
nicko Great work. Thank you. However I am having trouble getting it to print in the first bar. If ...
Marie-Eve Vergoz Bonsoir - Voici l'erreur qui est signalée lorsque je souhaite utiliser cet indicateur : il...
Meta Signals Pro Pleasure ! Please let us know if you make good trades with it and if you see improvements we...
francis59 Bonjour, Bonjour, comment puis-je créer un screener basé sur cet indicateur, qui affiche le...
Trader Sab I am curious to try it how, however I get an error message for line 47 and 48 - drawsegment,...
Om Hello, thanks for sharing! Getting a message that Variable P is undefined?
matin Intraday Average Volume Indicator Not working, what can i do plz
LucioleLucide Clean view, thanks for sharing
dertopen hi where i can found the window for candle configuration?
paolosab69 Ciao! . I have seen the pictures that explain this metod but i don't understand when is mome...
Ciccio
5 years ago
Vinks_o_7 Apirine also offers a very interesting update of the OBV...
TACBOLSA
5 years ago
dario ti please can you help me to understand? i know i am wrong: Long Histogram = High Volume S...
TAC Bolsa hi, I have already seen the problem and requested that it be removed until an adequate so...
sixeight Hey TAC, Did you ever find a solution to this?
Vinks_o_7 b=close > low and volume > high How can we compare volume and high of the day? (orang...
TAC Bolsa If to understand something you resort to compare Oranges and bananas. You go bad, Without e...
giumagi good morning Sir, great job your indicators! How can I reach your website or blog? please..t...
Gianluca THANK YOU!!!!!
JOSEBA que relaccion tiene la numeración de las barras del 1 al 10 que tiene cada número Tengo dos...
marcov66 Hi, it seems a very useful indicator. Unfortunately the link here for the full explanation d...
TACBOLSA Discontinued indicator. we are sorry.
Azzuerus Bonjour, je teste et j'utilise vos indicateurs depuis plusieurs années, et ils me sont dev...
bremze33 Another thing. Is it possible to make the graph lines a little thicker and not so long? Be...
giumagi Hi Sir, very good job done with this indicator, May I ask you to explain what is the line VW...
pmdr1969 Hola soy nuevo en en esto. ¿Hay algo parecido pero pudiendo tu elegir las velas a a analizar...
Nicolas Add indicator on price doesnt require any specific type of subcription. Click on the wrench ...
tahiti bonjour j'ai une petite question comment peux on enlevé la bar blanche sur la bougie en cour...
sixeight Hi Kris, is there a way to increase the number of rows? I get a loop error
Nicolas Good job Gabri, I confirm that with the new ProRealTime v11, everyone will be able to use in...
Slowlyslowly can u just help me with the exact definition of percbox , mm and period to understand will a...
Real Pro Great work gabri. I have this coded on Amibroker and I have done lots of backtesting but ne...
gabri Hi Real Pro, this indicator assists novices of the Wyckoff system. Wyckoff himself thought t...
tatie hi Gabri, I just came across the wyckoff method and was looking for the weiss wave indica...

Top