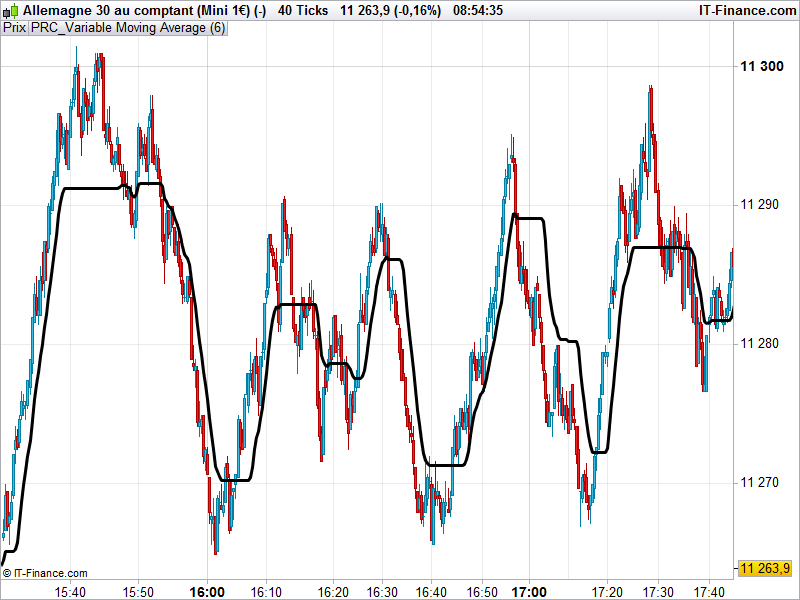
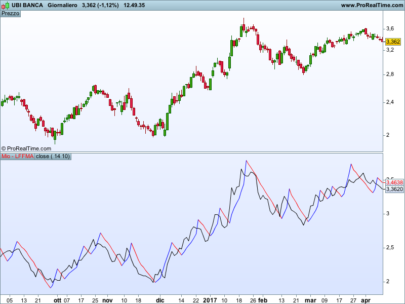
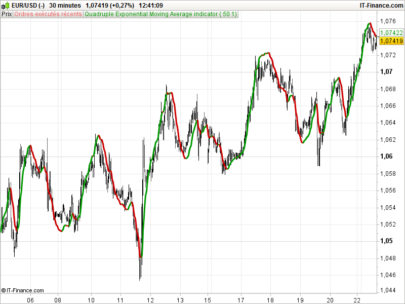
A VMA is an EMA that is able to regulate its smoothing percentage based on market inconstancy automatically. Its sensitivity grows by providing more weight to the ongoing data as it generates a better signal indicator for short and long-term markets.
The majority of ways for measuring Moving Averages cannot compensate for sideways moving prices versus trending markets and often generate a lot of false signals. Longer-term moving averages are slow to react to reversals in trend when prices move up and down over a long period of time. A Variable Moving Average regulates its sensitivity and lets it function better in any market conditions by using automatic regulation of the smoothing constant.
The Variable Moving Average is also known as the VIDYA Indicator. But this version is a modified concept of the VIDYA.
The Variable Moving Average was developed by Tushar S. Chande and first presented in his March, 1992 article in Technical Analysis of Stocks & Commodities magazine, in which a standard deviation was used as the Volatility Index. In his October, 1995 article in the same magazine, Chande modified the VIDYA to use his own Chande Momentum Oscillator (CMO) as the Volatility Index, the VMA code below is the result of this modification.
|
1 2 3 4 5 6 7 8 9 10 11 12 13 14 15 16 17 18 19 20 21 22 23 24 25 26 27 28 29 30 31 32 |
//PRC_Variable Moving Average | indicator //14.12.2016 //Nicolas @ www.prorealcode.com //Sharing ProRealTime knowledge //converted and adapted from Pinescript version // --- parameters src=customclose //l = 6 if barindex>l then k = 1.0/l pdm = max((src - src[1]), 0) mdm = max((src[1] - src), 0) pdmS = ((1 - k)*(pdmS[1]) + k*pdm) mdmS = ((1 - k)*(mdmS[1]) + k*mdm) s = pdmS + mdmS pdi = pdmS/s mdi = mdmS/s pdiS = ((1 - k)*(pdiS[1]) + k*pdi) mdiS = ((1 - k)*(mdiS[1]) + k*mdi) d = abs(pdiS - mdiS) s1 = pdiS + mdiS iS = ((1 - k)*(iS[1]) + k*d/s1) hhv = highest[l](iS) llv = lowest[l](iS) d1 = hhv - llv vI = (iS - llv)/d1 vma = (1 - k*vI)*(vma[1]) + k*vI*src endif RETURN VMA |
Share this
No information on this site is investment advice or a solicitation to buy or sell any financial instrument. Past performance is not indicative of future results. Trading may expose you to risk of loss greater than your deposits and is only suitable for experienced investors who have sufficient financial means to bear such risk.
ProRealTime ITF files and other attachments :
Find other exclusive trading pro-tools on ![]()
PRC is also on YouTube, subscribe to our channel for exclusive content and tutorials


Bonjour Nicolas,
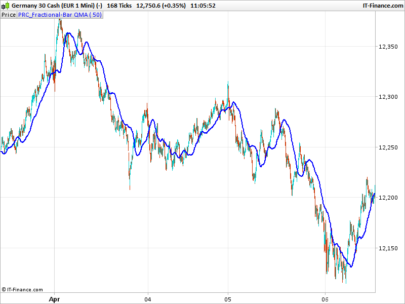
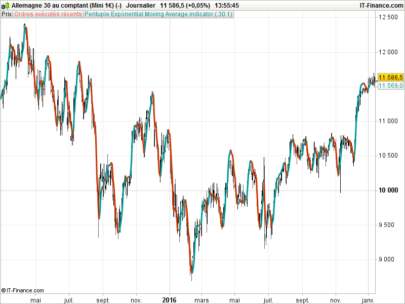
Je me suis amusé à doubler la VMA. Je ne sais pas si cela a un intéret…mais maintenant c’est fait ! 🙂
//PRC_Variable Moving Average | indicator
//14.12.2016
//Nicolas @ www.prorealcode.com
//Sharing ProRealTime knowledge
//converted and adapted from Pinescript version
// --- parameters
src=customclose
//l = 4
if barindex>l then
k = 1.0/l
pdm = max((src - src[1]), 0)
mdm = max((src[1] - src), 0)
pdmS = ((1 - k)*(pdmS[1]) + k*pdm)
mdmS = ((1 - k)*(mdmS[1]) + k*mdm)
s = pdmS + mdmS
pdi = pdmS/s
mdi = mdmS/s
pdiS = ((1 - k)*(pdiS[1]) + k*pdi)
mdiS = ((1 - k)*(mdiS[1]) + k*mdi)
d = abs(pdiS - mdiS)
s1 = pdiS + mdiS
iS = ((1 - k)*(iS[1]) + k*d/s1)
hhv = highest[l](iS)
llv = lowest[l](iS)
d1 = hhv - llv
vI = (iS - llv)/d1
vmacourte = (1 - k*vI)*(vmacourte[1]) + k*vI*src
endif
// --- parameters
src2=customclose
//l2 = 9
if barindex>l2 then
k2 = 1.0/l2
pdm2 = max((src2 - src2[1]), 0)
mdm2 = max((src2[1] - src2), 0)
pdmS2 = ((1 - k2)*(pdmS2[1]) + k2*pdm2)
mdmS2 = ((1 - k2)*(mdmS2[1]) + k2*mdm2)
s2 = pdmS2 + mdmS2
pdi2 = pdmS2/s2
mdi2 = mdmS2/s2
pdiS2 = ((1 - k2)*(pdiS2[1]) + k2*pdi2)
mdiS2 = ((1 - k2)*(mdiS2[1]) + k2*mdi2)
d2 = abs(pdiS2 - mdiS2)
s12 = pdiS2 + mdiS2
iS2 = ((1 - k2)*(iS2[1]) + k2*d2/s12)
hhv2 = highest[l2](iS2)
llv2 = lowest[l2](iS2)
d12 = hhv2 - llv2
vI2 = (iS2 - llv2)/d12
vmalongue = (1 - k2*vI2)*(vmalongue[1]) + k2*vI2*src2
endif
RETURN VMACOURTE coloured (100,100,215), VMALONGUE coloured (255,0,150)
Je n’arrive pas à joindre l’image qui montre la VMA Doublée…:(
Merci pour l’indicateur double VMA ! En effet, ajouter des images serait un plus dans les commentaires, je dois m’en occuper prochainement.
L’ indicateur a changé de Matriciel, pas vu sur 10-3.vous pouvez résoudre ce problème?merci
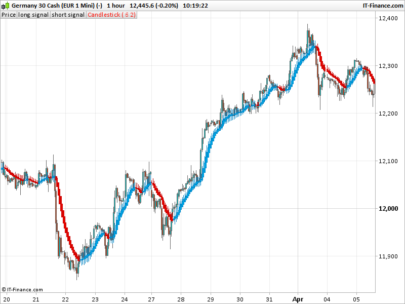
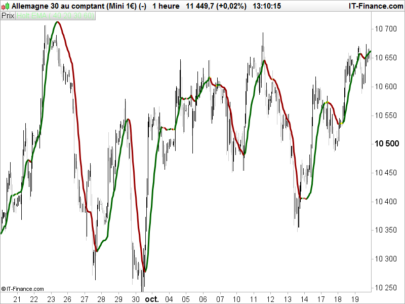
Une solution rapide consisterait à placer 2 fois l’indicateur avec des valeurs de “l” différente sur votre graphique Ernesto1.
Voici un code de VIDYA construit par Sohocool :
// MOYENNE EXPONENTIELLE ADAPTIVE VIDYA by Soho
a=2/(n+1)
if (STD[m](close)) <> 0 then
k= STD[n](close) / (std[m](close))
filt= a*k*close + (1-(a*k))*filt[1]
else
filt=close
endif
cc = customclose
return cc as \" cc \" , filt as \"vidya\"
// variables :
// n = 9 alpha et standard deviation
// m = 30 standard deviation
// a = alpha
Merci Supertiti.
Je trouve que ce code est difficile à règler et n’est pas d’une grande précision.
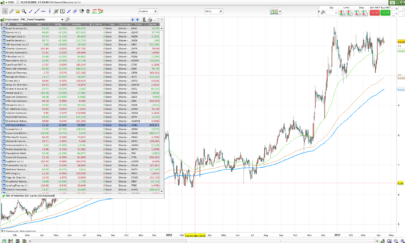
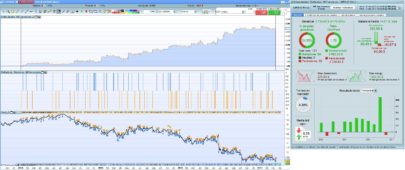
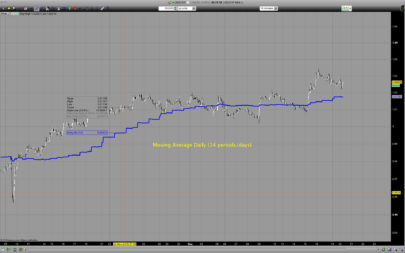
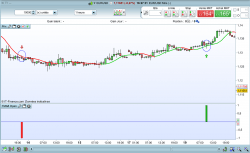
J’ai essayé avec deux différents I , a = 3 périodes et un 3 x 5 = 15 périodes.Ie comme si le TF est lissée de 3 minutes à 15 minutes, ceci est le résultat ..
Nicolas, anytime I have an idea, I just search for it on ProRealCode and usually you have done an adaptation. Excellent work, thanks!
I am aware I have promised to post something of my own, and would very much like to adapt the above to use R2 instead of CMO. However, this is spontaneously above my capabilities. Any chance you would be interested to have a go?
Kind regards,
Wilko
Of course! please add a query in probuilder forum and we’ll work together on this indicator project.
Hi Nicolas,
As far as I understand this is the Variable (CMO) Moving Average. However, when comparing Skechers (SKX) with a Sharescope graph the MA lines are different. The 6 period is somewhat similar but the 21 period is way off. I’m wondering if I’ve done something wrong? I have a side by side screenshot but am not allowed to attach a picture to this post. It is on dropbox at https://www.dropbox.com/s/v0ftuaup60mq6ra/2017-06-19%20%282%29.png?dl=0
Thank you.
I don’t know the formula of the moving average you are comparing this indicator with sorry.. They seems a lot different though, so I think they are completely different indicator!
There are a lot of different moving average type in this other indicator : https://www.prorealcode.com/prorealtime-indicators/average-filter-regression/
You might find something more relevant in them.
Thank you Nicolas. The Sharescope MA is also meant to be Variable (CMO) Moving Average. The formula I have for this is:
Today’s VMA value = ((EP * VR) * Close) + ((1 – (EP * VR)) * Yesterday’s MAwhere: EP is the Exponential Percentage = 2 / (time period + 1)VR is the Volatility Ratio = 9-day Chande Momentum Oscillator / 100
Not sure if this helps? I will go through the other MAs on the link you sent.
Paul
This formula has nothing to deal with the indicator of this post 🙂 I can translate it for sure, please add a request in the ProBuilder forum. Thank you.
Thank you very much! Request submitted.Paul
Bonjour,
Est-ce que quelqu’un peut me donner un lien vers la formule de base de cet indicateur. Tout ce que je peux trouver sur le net correspond à ce que Morgiza annonce (et est présenté comme le résultat des travaux de Chande), mais visiblement, Nicolas semble utiliser une autre formule… Je suis perdu!
Je l’ai converti depuis un code pinescript. De mémoire il s’agit bien d’une variation d’une moyenne mobile type Vydia.
@Nicolas, I’ve copied your code into PRT indicator panel to create it. When I attempt to save it a dialogue pops up saying “l2 is undefined”. I’m using PRT 10.3. I have checked that I am copying and pasting the code accurately. I can’t workout what’s wrong can you help?
Download the itf file and import it.