







Step One More Average
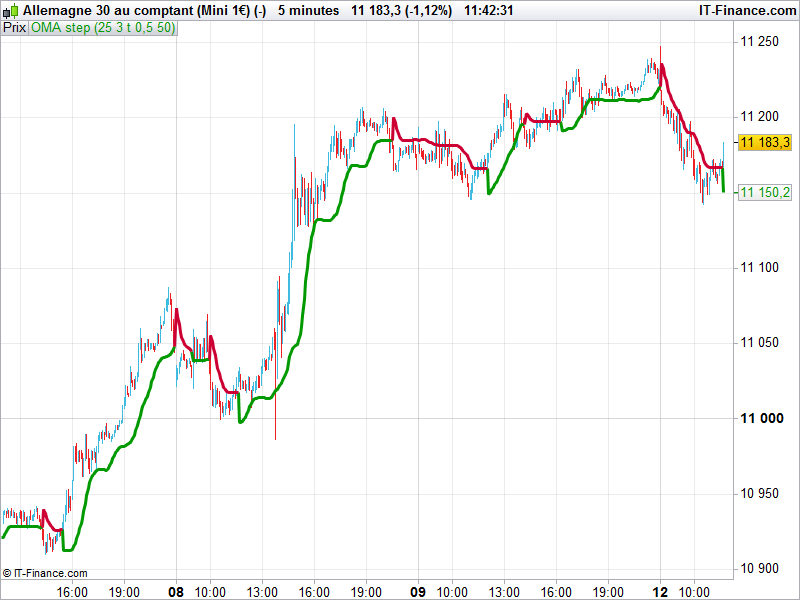
Indicator built upon a special moving average formula that adapt its period automatically accordingly to the market behaviour and noises. This moving average is called the OMA (One More Average), the formula come from an MT4 version found on internet.
Converted from MT4 because of a request on forum.
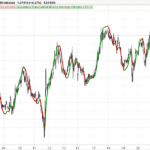
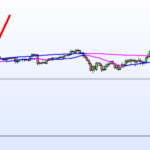
This version of the one more average indicator embed a step variation of the result of the calculation. The sensitivity and step size can be modified in order to adapt how the moving average respond to the step function, which is comparing how the moving average evolved between difference of actual and past data with current average true range.
The adaptive period can be more or less adaptive by changing the “speed” parameter (0.1 step). The adaptive behaviour of the formula can be shutdown with “Adaptive=0”.
//PRC_step one more average | indicator
//12.12.2016
//Nicolas @ www.prorealcode.com
//Sharing ProRealTime knowledge
//converted and adapted from MT4 version

//Length       = 25
//Speed        = 3.0
//Adaptive     = true;
//Sensitivity  = 0.5     // Sensivity Factor
//StepSize     = 50      // Step Size period

Length = Max(Length,1)
Speed  = Max(Speed,-1.5)

price = average[1](customclose)

//adaptive period
averagePeriod = Length
if adaptive=1 and averagePeriod > 1 then
 minPeriod = averagePeriod/2.0
 maxPeriod = minPeriod*5.0
 endPeriod = round(maxPeriod)
 signal    = Abs((price-stored[endPeriod]))
 noise     = 0.00000000001

 for k=1 to endPeriod do
  noise=noise+Abs(price-stored[k])
  averagePeriod = round(((signal/noise)*(maxPeriod-minPeriod))+minPeriod)
 next

endif

tconst=Speed

alpha = (2.0+tconst)/(1.0+tconst+averagePeriod)

e1 = e1 + alpha*(price-e1)
e2 = e2 + alpha*(e1-e2)
v1 = 1.5 * e1 - 0.5 * e2
e3 = e3 + alpha*(v1   -e3)
e4 = e4 + alpha*(e3-e4)
v2 = 1.5 * e3 - 0.5 * e4
e5 = e5 + alpha*(v2   -e5)
e6 = e6 + alpha*(e5-e6)
v3 = 1.5 * e5 - 0.5 * e6

stored=price

//step function
Sensitivity = max(Sensitivity,1*pointsize)
ATRStepSize=averagetruerange[StepSize]
Step = max(ATRStepSize,1*pointsize)
size = sensitivity*Step
phigh = v3
plow = v3[7]
stepMulti = 1.0
workStepsmax  = phigh+2.0*size*stepMulti
workStepsmin  = plow-2.0*size*stepMulti
workSteptrend = workSteptrend[1]
pprice = customclose
if (pprice>workStepsmax[1]) then
 workSteptrend =  1
endif
if (pprice<workStepsmin[1]) then
 workSteptrend = -1
endif
if (workSteptrend =  1) then
 if (workStepsmin < workStepsmin[1]) then
  workStepsmin=workStepsmin[1]
 endif
 result = workStepsmin+size*stepMulti
 color = 1
endif

if (workSteptrend = -1) then
 if (workStepsmax > workStepsmax[1]) then
  workStepsmax=workStepsmax[1]
 endif
 result = workStepsmax-size*stepMulti
 color = -1
endif

RETURN result coloured by color as "OMA step"
Comments
You must be logged in to post a comment.


Hello Nicolas,
thanks a lot for your many contributions in this post. I have a problem with the imported file: when I import it into the Price chart, I just get a flat line at the "0" level, no average is plotted.
I have 10.3 version of PRT.
Any suggestion would be wellcome.
Best regards,
Jorge Hernando
Bonjour Nicolas. J'utilise la version 11 et moi aussi j'ai une ligne horizontale malgré l'ajout du test "if barindex>length". Existe-t-il une incompatibilité entre la version de PRT 2016 et 2021? Cordialement.