







Trend Template by Mark Minervini
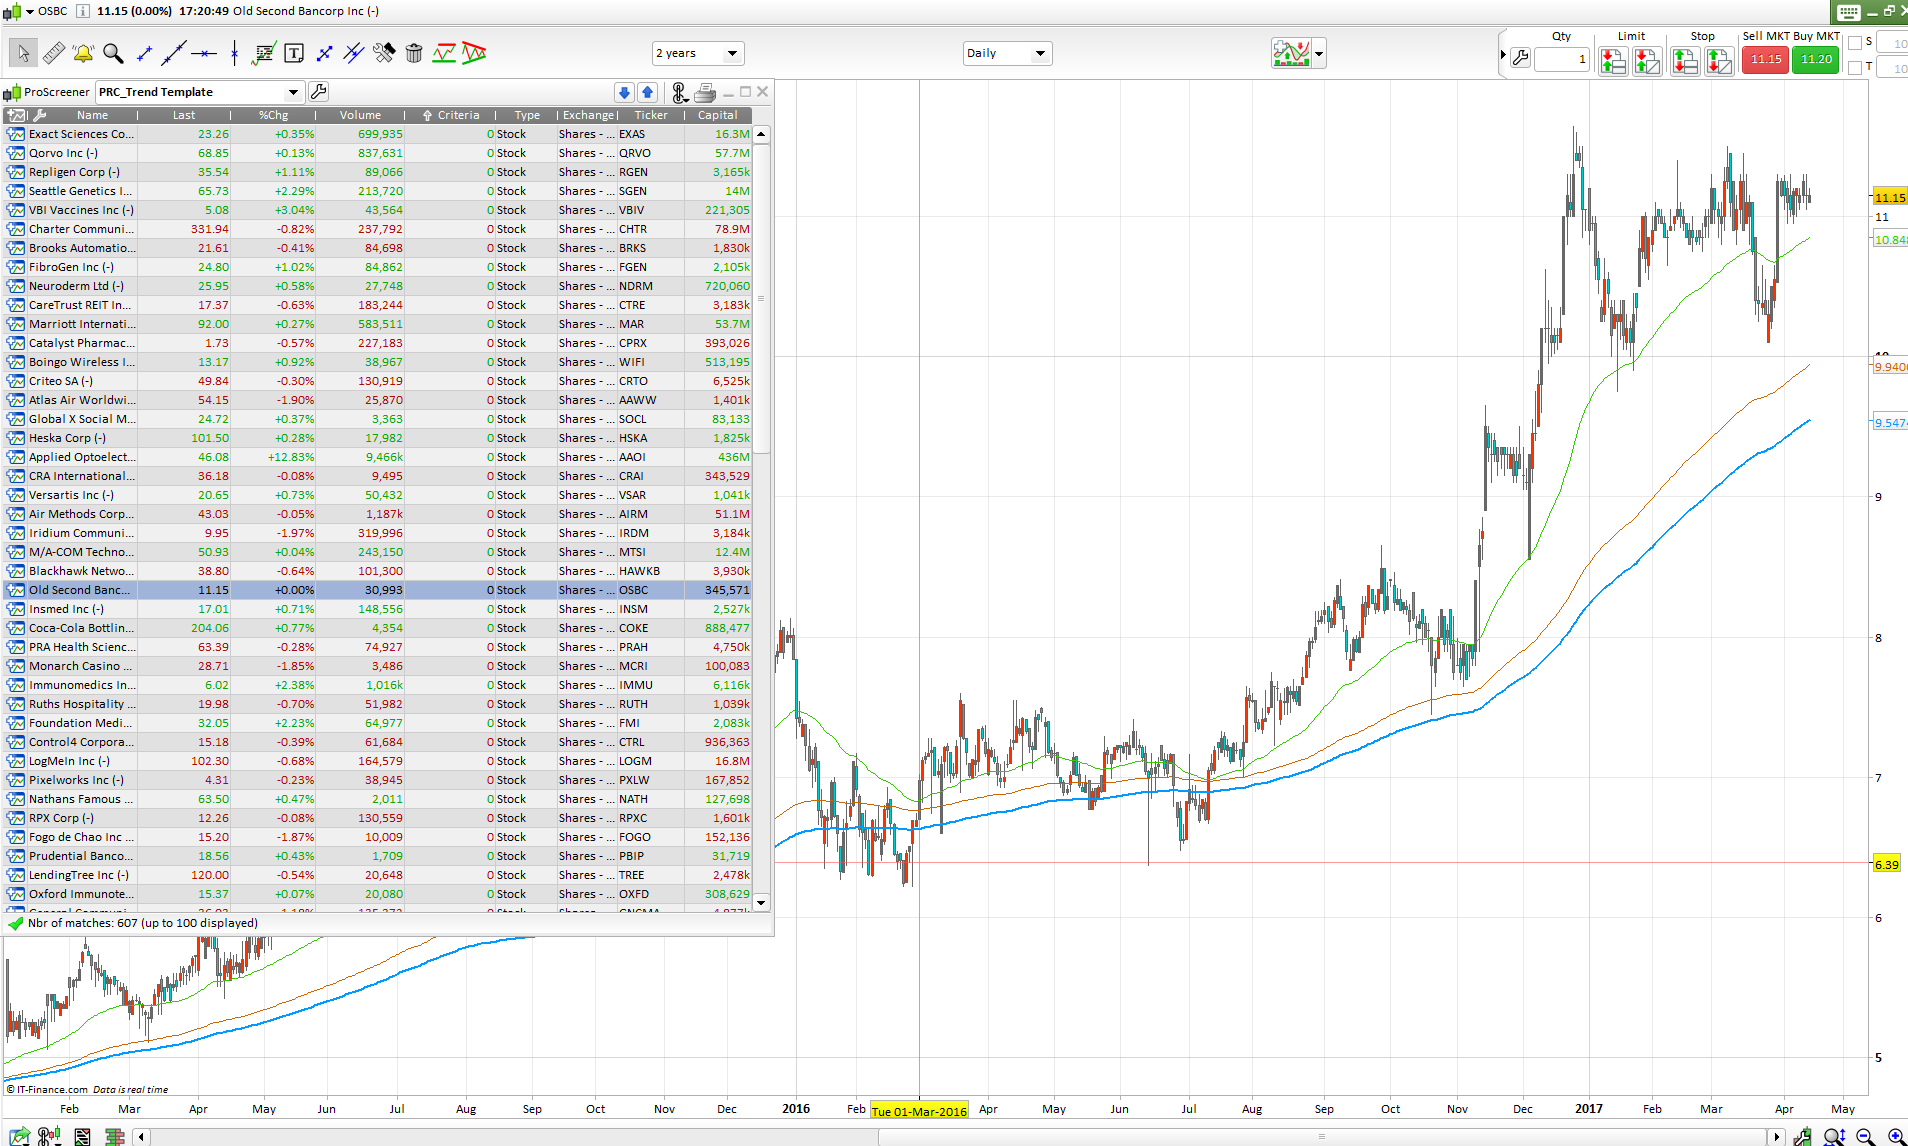
The Trend Template stock screener is a set of selection criteria by Market Wizard Mark Minervini. Here are the rules:
- The current stock price is above both the 150-day (30-week) and the 200-day (40-week) moving average price lines.
- The 150-day moving average is above the 200-day moving average.
- The 200-day moving average line is trending up for at least 1 month (preferably 4–5 months minimum in most cases).
- The 50-day (10-week) moving average is above both the 150-day and 200-day moving averages.
- The current stock price is trading above the 50-day moving average.
- The current stock price is at least 30 percent above its 52-week low. (Many of the best selections will be 100 percent, 300 percent, or greater above their 52-week low before they emerge from a solid consolidation period and mount a large scale advance.)
- The current stock price is within at least 25 percent of its 52-week high (the closer to a new high the better).
//PRC_Trend Template | screener
//13.04.2017
//Nicolas @ www.prorealcode.com
//Sharing ProRealTime knowledge

ma50=average[50]
ma150=average[150]
ma200=average[200]

c1 = Close > average[50]
c2 = ma50>ma150
c3 = ma150>ma200
c4 = summation[20](ma200>ma200[1])=20
c5 = Close/lowest[250](low)>1.3
c6 = Close/highest[250](high)>0.75

TrendTemplate = c1 and c2 and c3 and c4 and c5 and c6

screener[TrendTemplate]
Comments
You must be logged in to post a comment.

Dsl, je n'avais pas mis le lien du post ("https://www.prorealcode.com/topic/tester-un-screener-avec-une-variable-date/") pour expliquer ma demande. Je souhaite mettre en place la variable JOUR (JOUR=nombre de jours antérieurs) dans le screener, pour qu'il me renvoie une liste d'actions à une date précise.




Hi Nicolas, thanks for the Minervini screener, I'm finding it really useful. I am a big fan of pocket pivots and am wondering if coding to detect pocket pivots could be added to this screener to make it more sensitive to an impending move? Essentially adding in some coding to detect when the day’s volume is larger than the highest down volume day over the prior 10 days. Can I send you a message through the programming services form for this? Cheers Hayden

Great screener!! I would like to add only the fact that Minervini is a growth investor and so he picks stocks based on fundamentals AND technical analysis. I suggest to use periods of 254 instead of 300, 66 instead of 50 and 130 instead of 150 to reflect the trimester/semester/annual reports normally released by companies if trading the stock market. 200/150/50 is perfect for everything else.


Hi Nicolas,
The results are not identical
ma200 = Arevage(200)

//c4 = summation[20](ma200 > ma200[1]) = 20
c4 = summation[20](Average[200] > Average[200](1)) = 20
My interpretation:
// Trend Template by Mark Minervini Opti ?

ma50 = Average[50]
ma150 = Average[150]
ma200 = Average[200]

c1 = Close > ma200
c2 = Close > ma150
c3 = ma150 > ma200

//c4 = summation[20](Average[200] > Average[200](1)) = 20
c4 = ma200/ma200[25] > 0.025

c5 = ma50 > ma200
c6 = ma50 > ma150
c7 = Close > ma50

c8 = Close / Lowest[252](low) > 1.3 //dochian
c9 = Close / Highest[252](high) > 0.75 //dochian


IF c1 AND c2 AND c3 AND c4 AND c5 AND c6 AND c7 AND c8 AND c9 THEN

 Trend = 1

ELSE

 Trend = 0

ENDIF

Return Trend
WHEN TO SELL ?
Earlier in the thread, cfro mentioned :
LO, Andrew W. and HASANHODZIC, Jasmina (2010) The Heretics of Finance : Conversations with Leading Practitioners of Technical Analysis. (New York : Bloomberg).
There is a great chapter in the book comprising an interview with Stan Weinstein. It offers some terrific insights relevant to the “Stage 2”. Among these are the following :
-
Weinstein explains that he does in fact base his trading on the use of three moving averages : 50-day, 150-day and 200-day : exactly as described by Minervini. This was not revealed in his book Secrets for Profiting in Bull and Bear Markets. Perhaps he just wanted to keep it as simple as possible in the book by only referencing the 150-day MA.
-
What I think is potentially the most important new point : Weinstein goes on to explain how he uses the three moving averages as a mechanical exit rule, which he says he never ever deviates from.
-
If price falls below the 50-day MA he will sell one third of his position, unquestionably – as risk management.
-
If price rises back above the 50-day MA, he will consider buying back the third he sold (but would not necessarily do so).
-
However, if price continues to weaken and goes below the 150-day MA he will sell another third.
- Finally, if price falls below the 200-day MA he exits the remainder of his position.
Essentially, while he does not say it in exactly these words, Weinstein believes that any volatility that occurs while the price remains above its 50-day MA, is ‘volatility to ignore’. However, if the 50-day MA is breached : start to use the rules described above.
Not mentioned by Weinstein, a further “warning signal” that could/should demand defensive action, is when the 50-day MA crosses below the 150-day MA.
A mantra of Weinstein and so many other gurus is KEEP YOUR LOSSES SMALL !
Weinstein’s system seems a sound one for helping to do this. The thread has offered insights from both Weinstein and Minervini on when to BUY Stage 2 stocks.
Weinstein’s system offers objective criteria for when to SELL, which is often one of the hardest investment decisions to make.
We all know we should run our winners. While the 50-day, 150-day and 200-day moving averages are all rising and all in the correct “traffic light” order, and last but not least, price remains above all three moving averages : the technicals, according to Weinstein, say : “stay in the stock”.
Source:
h**p://shareinfo.myfastforum.org/archive/the-stage-2-pub__o_t__t_1151.html
h**p://stockbee.blogspot.fr/2017/05/how-to-setup-mark-minervini-trend.html
Enjoy ^^



thanks for the screener mate cheers




Hello Nicolas! I wonder if you would like to help me. I have a very good (and simple) signal (formation) that I am trying to program in the market scanner, but I must be doing something wrong.
It has a hitrate of 82% (very big backtesting in Multicharts) , so very useful, and I am sure that you will like it, if you try it.
I Think for someone as proffesional as you in programming, you could help me out in 1-2 minutes or so. Would you like to try? If yes, Maybe we can make a screensharing, and I can show explain
what a I mean. I have teamviewer. If yes, maybe you can start sending me in e-mail
I would appreciate your help. :-)
Hi Nicolas, thx for your code. Please i need your help to understand this part of your code: c4 = summation[20](ma200>ma200[1])=20 Thx