

EMA5 - TMA8 trading signals
August 23, 2016, 10:11 AM
Indicators
2 Comments
Hi all,
Here is a simple code asked by one of my website user.
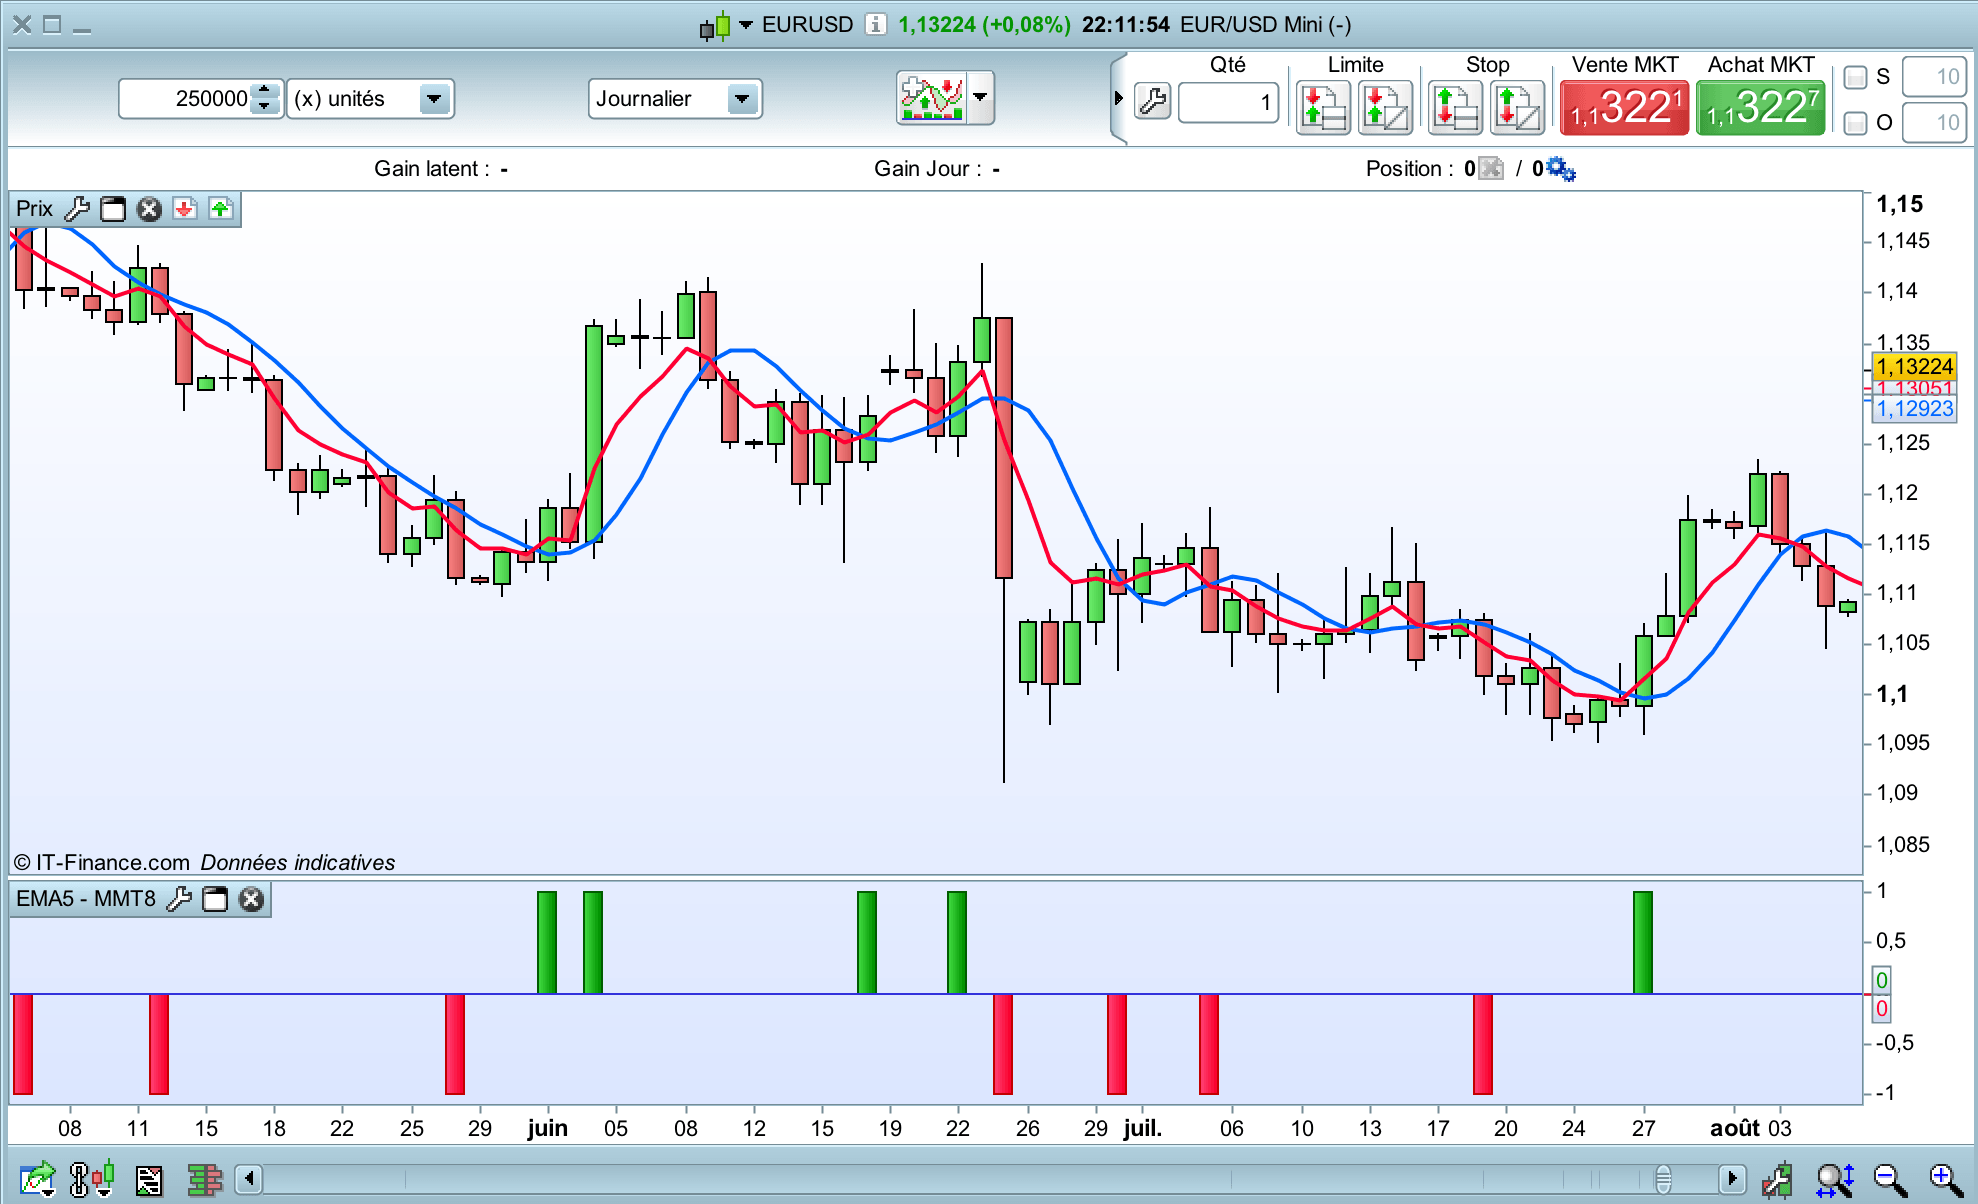
We have a BUY signal (green) if :
- the exponential average 5 (close) > the triangular average 8 (close)
- close > triangular average 8 but close of the previous candle < triangular average 8
Of course, we have a SELL signal (red) for the inverted conditions.
Don’t forget to set “achat” and “vente” to Histogram, and to set the colors.
I also added a blue line with value “0”.
The EMA5 is in red, the TMA8 is in blue.
achat = 0
vente = 0

// INDICATEURS
EMA5 = ExponentialAverage[5](close)
TMA8 = TriangularAverage[8](close)

// ACHAT
ca1 = close[1] < TMA8 and close > TMA8
ca2 = EMA5 > TMA8

IF ca1 and ca2 THEN
achat = 1
ENDIF

// VENTE
cv1 = close[1] > TMA8 and close < TMA8
cv2 = EMA5 < TMA8

IF cv1 and cv2 THEN
vente = -1
ENDIF

return achat as "ACHAT", vente as "VENTE"
Download
Filename:
EMA5-TMA8.itf
Downloads:
304
Master
Hello, I'm Marc.
Nice to meet you.
Author’s Profile
Loading...