

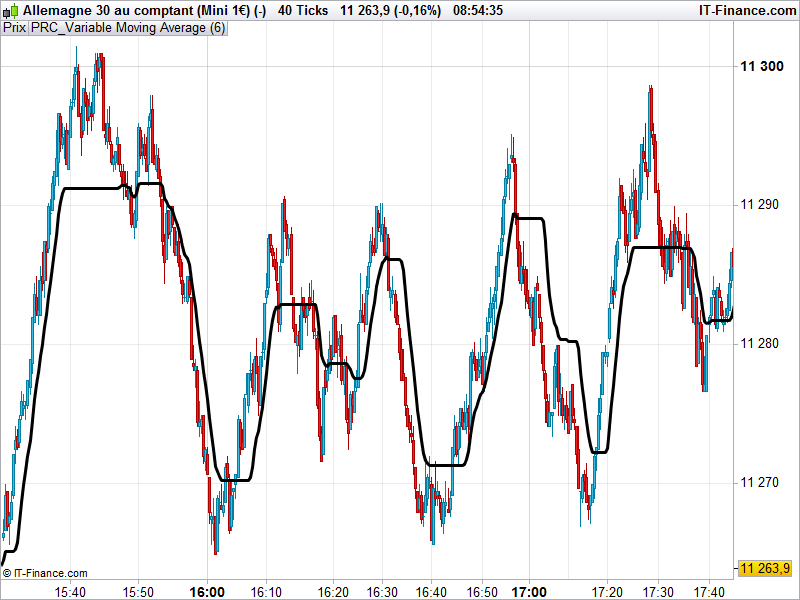
Variable Moving Average (VMA)
A VMA is an EMA that is able to regulate its smoothing percentage based on market inconstancy automatically. Its sensitivity grows by providing more weight to the ongoing data as it generates a better signal indicator for short and long-term markets.
The majority of ways for measuring Moving Averages cannot compensate for sideways moving prices versus trending markets and often generate a lot of false signals. Longer-term moving averages are slow to react to reversals in trend when prices move up and down over a long period of time. A Variable Moving Average regulates its sensitivity and lets it function better in any market conditions by using automatic regulation of the smoothing constant.
The Variable Moving Average is also known as the VIDYA Indicator. But this version is a modified concept of the VIDYA.
The Variable Moving Average was developed by Tushar S. Chande and first presented in his March, 1992 article in Technical Analysis of Stocks & Commodities magazine, in which a standard deviation was used as the Volatility Index. In his October, 1995 article in the same magazine, Chande modified the VIDYA to use his own Chande Momentum Oscillator (CMO) as the Volatility Index, the VMA code below is the result of this modification.
//PRC_Variable Moving Average | indicator
//14.12.2016
//Nicolas @ www.prorealcode.com
//Sharing ProRealTime knowledge
//converted and adapted from Pinescript version

// --- parameters
src=customclose
//l = 6

if barindex>l then
 k = 1.0/l
 pdm = max((src - src[1]), 0)
 mdm = max((src[1] - src), 0)
 pdmS = ((1 - k)*(pdmS[1]) + k*pdm)
 mdmS = ((1 - k)*(mdmS[1]) + k*mdm)
 s = pdmS + mdmS
 pdi = pdmS/s
 mdi = mdmS/s
 pdiS = ((1 - k)*(pdiS[1]) + k*pdi)
 mdiS = ((1 - k)*(mdiS[1]) + k*mdi)
 d = abs(pdiS - mdiS)
 s1 = pdiS + mdiS
 iS = ((1 - k)*(iS[1]) + k*d/s1)
 hhv = highest[l](iS)
 llv = lowest[l](iS)
 d1 = hhv - llv
 vI = (iS - llv)/d1
 vma = (1 - k*vI)*(vma[1]) + k*vI*src
endif

RETURN VMA