







Renko automated trading system
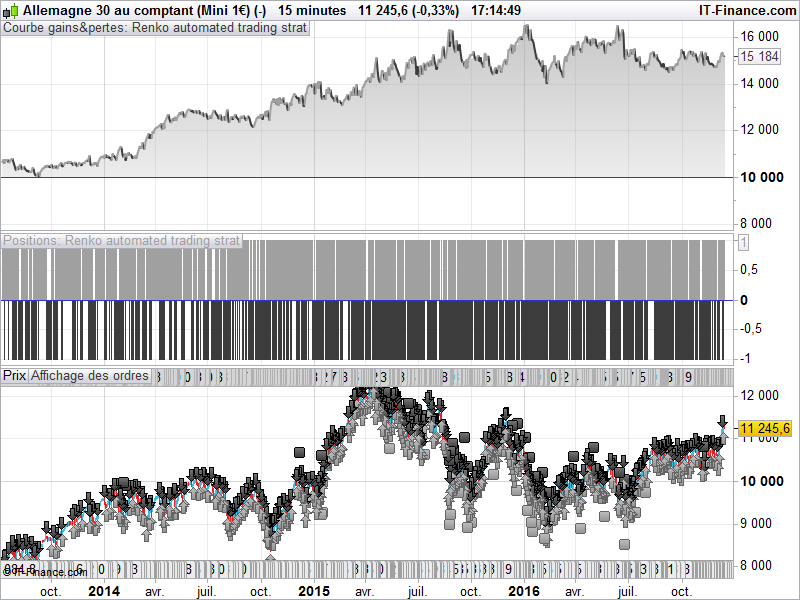
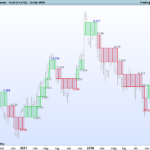
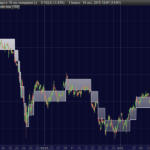
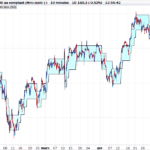
Renko trading system (very general, applicable e.g. for DAX 15 min chart) goes long when at least 2 upbricks appear after a downtrend of 2 bricks or more goes short when 2 downbricks appear after an uptrend of 2 bricks or more.
“bricksize” is the length of a Renko brick in points and be modified (line 3).
“BIfirst” is the first bar in the chart that defines the position of all other Renko bricks. Can be left out, but can makes a big difference.
defparam cumulateorders = false

bricksize = 22
BIfirst = 1

n = 1

If barindex >= BIfirst then
 ONCE upbrick = close
 ONCE downbrick = close - bricksize

 buysignal = 0
 shortsignal = 0

 IF close >= upbrick + bricksize THEN
  newbricksup = (round(((close - upbrick) / bricksize) - 0.5))
  diffup = newbricksup * bricksize
  downbrick = downbrick + diffup
  upbrick = upbrick + diffup
  totalbricksup = totalbricksup + newbricksup
  totalbricksdown = 0

  If (totalbricksup[1] = 0 OR totalbricksup[1] = 1) AND totalbricksup >= 2  then
   buysignal = 1
  endif

ELSIF close <= downbrick - bricksize THEN
  newbricksdown = (round(((downbrick - close) / bricksize) - 0.5))
  diffdown = newbricksdown * bricksize
  upbrick = upbrick - diffdown
  downbrick = downbrick - diffdown
  totalbricksdown = totalbricksdown + newbricksdown
  totalbricksup = 0

  If (totalbricksdown[1] = 0 OR totalbricksdown[1] = 1) AND totalbricksdown >= 2  then
   shortsignal = 1
  endif

 ENDIF

endif

If buysignal = 1 then
 buy n contracts at market
endif

If shortsignal = 1 then
 sellshort n contracts at market
endif

set stop ploss 120
Comments
You must be logged in to post a comment.

Hi, I tested this strategy on Spot Gold with a brick size of 20 on the weekly timeframe with ProTester and manually. (Reverse 5 lots after a swing of two bricks over 10 years) The problem is I got very different results. Based on the ProTester results I will not trade the strategy, but based on the results of the manually test I can’t wait. Maybe I don’t understand the strategy because of my poor programming skills. What I am looking for is an automated strategy which reverse a trade of a specific lot size after two reversed bricks of an adjustable fixed size. The intention is to be always in the market with the strategy. Is this the right strategy for this?


Hi to all, please try to test on 1 febrary to 15 febrary 2016.....
The profit factor depends very much on the brick size AND on the position of the first bar of the chart, in which the position of all following bricks is fixed. Therefore, the profit factor can be very different. In the example shown above (DAX 15 min chart, start on 1/1/2014, 24 h timescale), for a brick size of 18, the profit factor is 1.40 (total 12.517 DAX points), for a brick size of 22 the profit factor is 1.25 (total result 7.706 DAX points). The first brick is located in the first bar of 2014, when you put it elsewhere, you will get different results.
|
Profit |
Profit in % |
Number of Positions |
Winning Trades in % |
Profit / Position |
brick size |
|
12.610,2000 |
+12,61% |
916 |
+40,94% |
13,7666 |
17 |
|
12.517,3000 |
+12,52% |
830 |
+41,98% |
15,0811 |
18 |
|
12.114,2000 |
+12,11% |
1072 |
+39,96% |
11,3006 |
15 |
|
12.107,0000 |
+12,11% |
990 |
+41,01% |
12,2293 |
16 |
|
11.419,5000 |
+11,42% |
714 |
+41,80% |
15,9937 |
21 |
|
9.785,1000 |
+9,79% |
1321 |
+38,03% |
7,4073 |
13 |
|
9.614,9000 |
+9,61% |
752 |
+41,94% |
12,7858 |
20 |
|
9.497,1000 |
+9,50% |
812 |
+41,43% |
11,6959 |
19 |
|
8.062,8000 |
+8,06% |
1204 |
+38,94% |
6,6967 |
14 |
|
7.822,2000 |
+7,82% |
574 |
+41,46% |
13,6275 |
25 |
|
7.706,9000 |
+7,71% |
692 |
+41,47% |
11,1371 |
22 |
|
7.277,7000 |
+7,28% |
1479 |
+37,44% |
4,9207 |
12 |
|
7.030,8000 |
+7,03% |
648 |
+42,44% |
10,8500 |
23 |
|
6.948,4000 |
+6,95% |
433 |
+39,49% |
16,0471 |
31 |
|
6.694,8000 |
+6,69% |
1655 |
+36,86% |
4,0452 |
11 |
|
6.596,8000 |
+6,60% |
515 |
+40,19% |
12,8093 |
28 |
|
6.469,1000 |
+6,47% |
632 |
+42,09% |
10,2359 |
24 |
|
6.415,5000 |
+6,42% |
329 |
+38,30% |
19,5000 |
38 |
|
5.870,0000 |
+5,87% |
529 |
+40,83% |
11,0964 |
27 |
|
5.414,0000 |
+5,41% |
567 |
+41,98% |
9,5485 |
26 |
|
5.341,1000 |
+5,34% |
463 |
+38,44% |
11,5359 |
30 |
|
5.255,5000 |
+5,26% |
344 |
+36,05% |
15,2776 |
37 |
|
4.884,6000 |
+4,88% |
1865 |
+36,86% |
2,6191 |
10 |
|
4.624,6000 |
+4,62% |
300 |
+36,67% |
15,4153 |
42 |
|
4.571,7000 |
+4,57% |
491 |
+40,12% |
9,3110 |
29 |
|
4.486,2000 |
+4,49% |
390 |
+37,95% |
11,5031 |
35 |
|
4.318,8000 |
+4,32% |
432 |
+37,50% |
9,9972 |
32 |
|
4.243,9000 |
+4,24% |
331 |
+36,86% |
12,8215 |
39 |
|
4.096,8000 |
+4,10% |
2775 |
+36,16% |
1,4763 |
7 |
|
3.812,0000 |
+3,81% |
2409 |
+36,14% |
1,5824 |
8 |
|
3.727,8000 |
+3,73% |
406 |
+38,18% |
9,1818 |
34 |
|
3.568,2000 |
+3,57% |
374 |
+36,90% |
9,5406 |
36 |
|
3.506,5000 |
+3,51% |
289 |
+33,91% |
12,1332 |
43 |
|
3.473,1000 |
+3,47% |
2101 |
+37,10% |
1,6531 |
9 |
|
3.376,8000 |
+3,38% |
326 |
+37,12% |
10,3583 |
40 |
|
2.798,3000 |
+2,80% |
431 |
+37,59% |
6,4926 |
33 |
|
2.756,0000 |
+2,76% |
287 |
+34,15% |
9,6028 |
44 |
|
2.304,9000 |
+2,30% |
318 |
+34,91% |
7,2481 |
41 |
|
1.095,5000 |
+1,10% |
273 |
+31,87% |
4,0128 |
46 |
|
960,2000 |
+0,96% |
3301 |
+35,20% |
0,2909 |
6 |
|
835,6000 |
+0,84% |
255 |
+32,68% |
3,2769 |
49 |
|
624,2000 |
+0,62% |
3970 |
+35,05% |
0,1572 |
5 |
|
296,5000 |
+0,30% |
255 |
+31,50% |
1,1627 |
50 |
|
15,9000 |
+0,02% |
263 |
+33,21% |
0,0605 |
48 |
|
-36,3000 |
-0,04% |
276 |
+30,55% |
-0,1315 |
47 |
|
-1.807,2000 |
-1,81% |
4810 |
+35,43% |
-0,3757 |
4 |
|
-2.289,9000 |
-2,29% |
297 |
+31,65% |
-7,7101 |
45 |
|
-3.860,4000 |
-3,86% |
7888 |
+33,62% |
-0,4894 |
2 |
|
-5.570,2000 |
-5,57% |
6088 |
+34,00% |
-0,9149 |
3 |
|
-7.223,4000 |
-7,22% |
10776 |
+32,67% |
-0,6703 |
1 |

Then, take a good box size and vary the first bar of the chart that defines the position of the first Renko box and therefore of all other Renko boxes for the whole chart for all times. You will see that the result depends enormously on the exact position of the first Renko box ! Renko trading alone is therefore a lot of chance, and not reliable, in my opinion. May be it can be combined with other indicators and entry/exit conditions, but I have not tried.
I was just interested whether trading with Renko charts is really as great as the charts superficially look like, and apparently it is not.
Looks good, but perhaps is not. Try to vary the box size first and look at the variation of the results. Of course, everything will depend on a suitable box size. But is there such a thing ?
(Sorry, I tried to upload an optimization report as .jpg, but it always says : http upload error. Don't know why.)

I am learning to code. I try to understand these lines newbricksup = (round(((close - upbrick) / bricksize) - 0.5)) diffup = newbricksup * bricksize downbrick = downbrick + diffup upbrick = upbrick + diffup totalbricksup = totalbricksup + newbricksup totalbricksdown Could you eventually explain? Could we introduce also a condition to be above ou under a moving average of 20? Thank a lot.