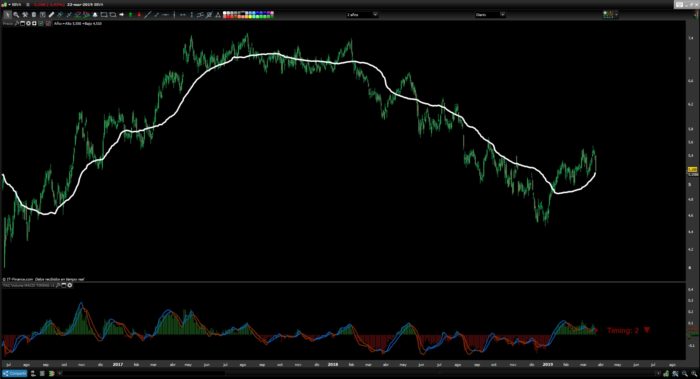
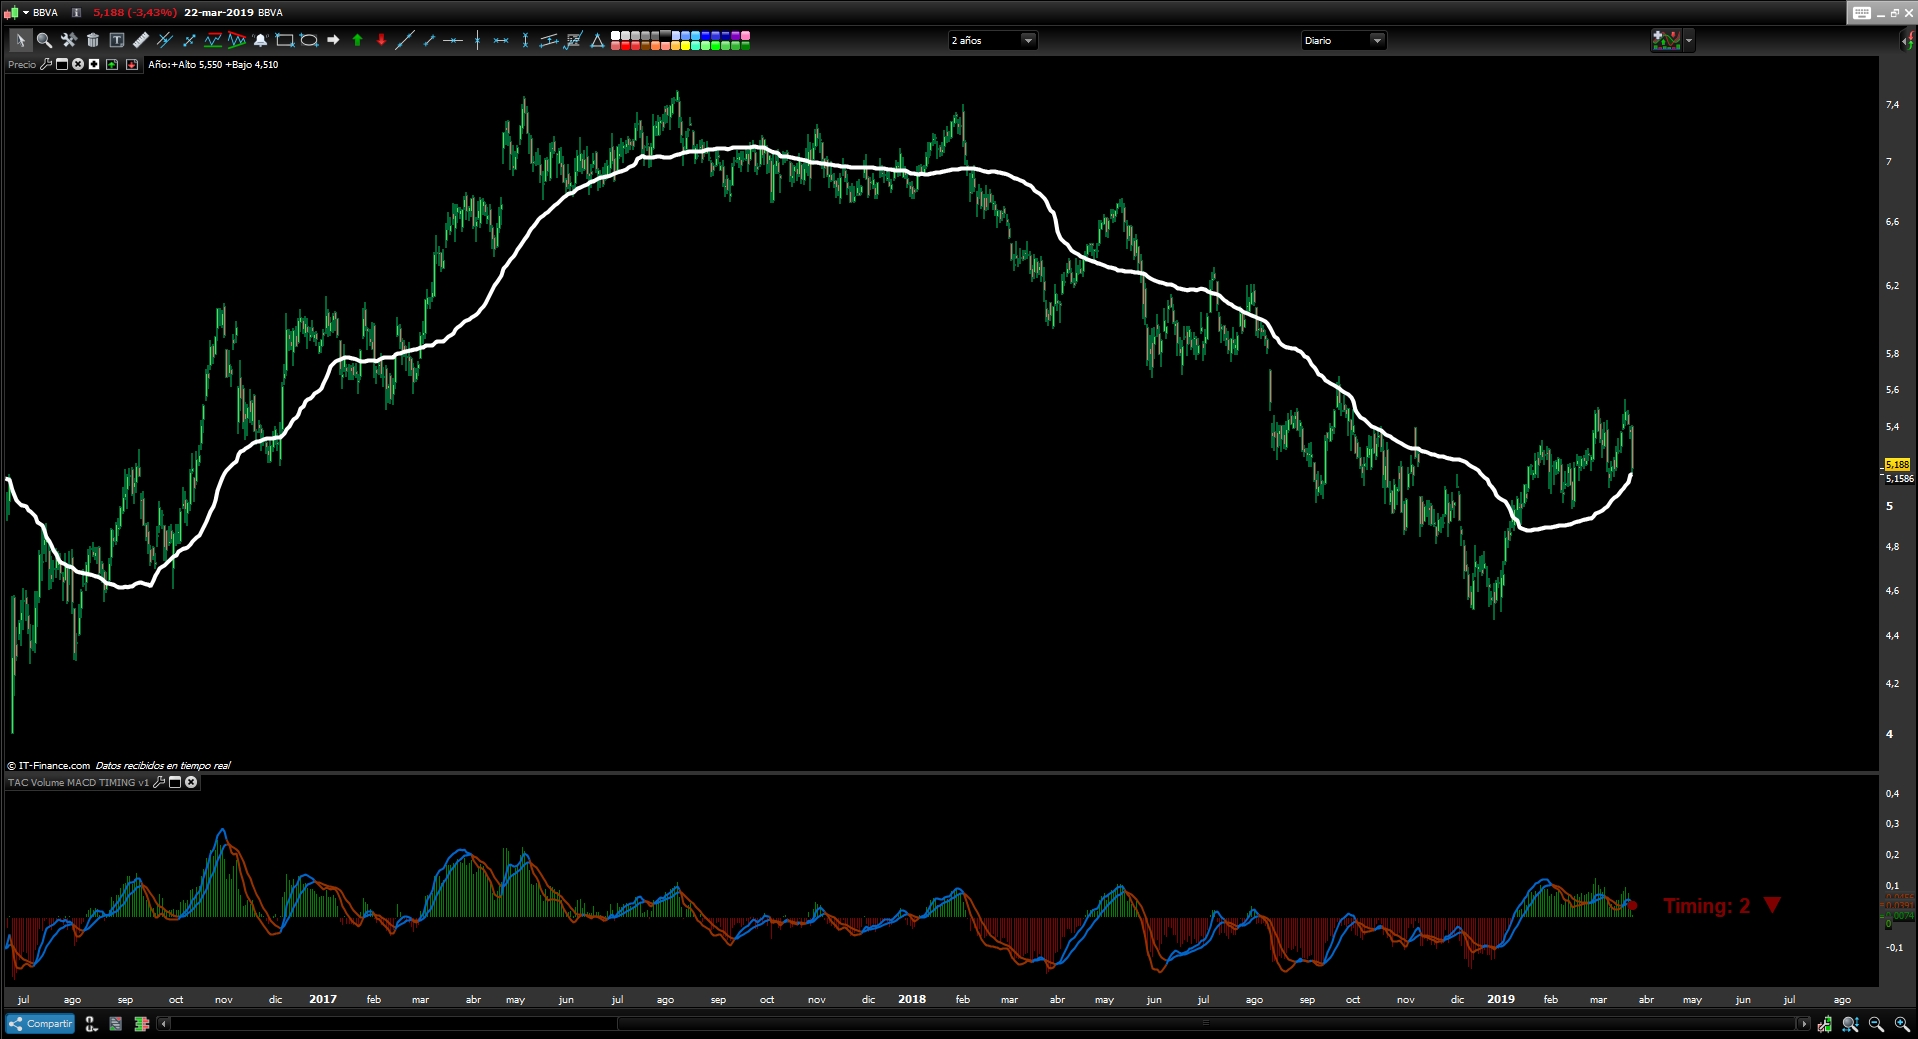
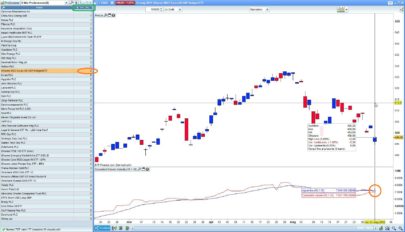
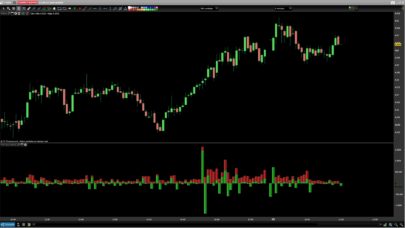
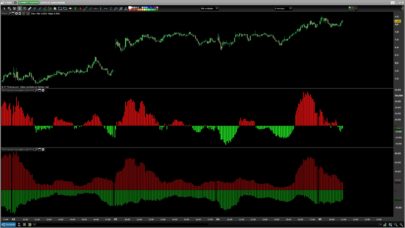
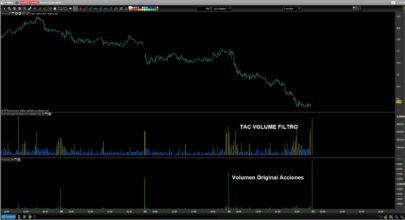
Multi-Indicator that combines several indicators to automate the movement of the price and trend based on the average of the entire volume distribution.
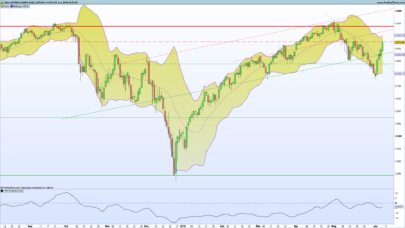
Wave: Average of the whole distribution of the volume in histogram form that measures the distance with the price, this provides in histogram mode the strength of the value based on the volume and marks the high point in the Histogram of the price reversal.
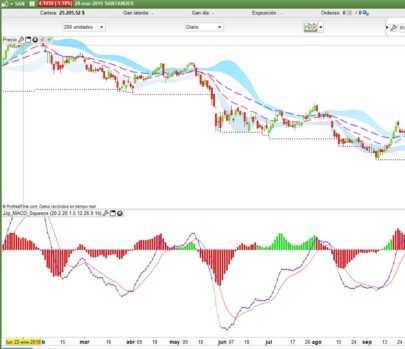
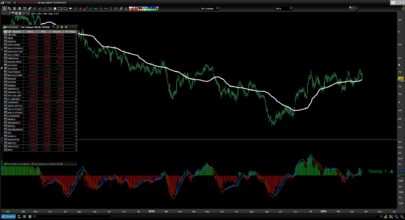
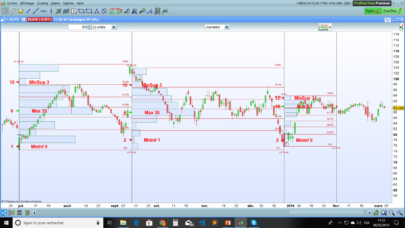
Timing: Recognizes all movements of the MACD indicator and lists them based on the trend obtained from the MACD and Wave indicators.
Bullish Trend
- Timing 1: Bullish Momentum
- Timing 2: Correction of Bullish Impulse
- Timing 3: Possible Reversal of the “Bearish” trend, Pause Trading
- Timing 4: Possible Reversal of the trend, Pause Trading
– The Timing 3 bullish trend will not work.
– The Timing 4 is a Timing of Pause, being this Timing the one that marks the bullish impulse in a market ceiling can be a trap. We have to wait for Timing 1 to confirm the continuation of the bullish momentum so as not to have a reversal of the movement and possible change of trend.
Bearish Trend
- Timing -1: Bearish Momentum
- Timing -2: Bullish Momentum of the Bearish trend
- Timing -3: Possible Reversion of the trend, Pause Trading
- Timing -4: Possible Continuation of the trend, Pause Trading
Documentation link
https://www.tiburonesdealetacorta.com/2019/03/tac-volume-macd-timing.html
|
1 2 3 4 5 6 7 8 9 10 11 12 13 14 15 16 17 18 19 20 21 22 23 24 25 26 27 28 29 30 31 32 33 34 35 36 37 38 39 40 41 42 43 44 45 46 47 48 49 50 51 52 53 54 55 56 57 58 59 60 61 62 63 64 65 66 67 68 69 70 71 72 73 74 75 76 77 78 79 80 81 82 83 84 85 86 87 88 89 90 91 92 93 94 95 96 97 98 99 100 101 102 103 104 105 106 107 108 109 110 111 112 113 114 115 116 117 118 119 120 121 122 123 124 125 126 127 128 129 130 131 132 133 134 135 136 137 138 139 140 141 142 143 144 145 146 147 148 149 150 151 |
/////////////////////////////////////////////////////////////////////// REM TAC Volume MACD TIMING REM TAC Volume MACD TIMING | indicator REM 01.09.2011 REM TAC @ www.tiburonesdealetacorta.com REM Sharing www.tiburonesdealetacorta.com //////////////////////////////////////////////////////////////////////// defparam drawonlastbaronly=true pc=12 pl=26 ps=9 cero=0 n=60 lv1=0 lv2=0 for i= 0 to n do lv1=lv1+close[i]*Volume[i] lv2=lv2+Volume[i] next lv=lv1/lv2 Wave = close - lv a=MACD[12,26,9](close) hh=exponentialaverage[pc](close) - exponentialaverage[pl](close) REM Signal hh1=exponentialaverage[ps](hh) if Wave crosses over 0 then drawtext("●",barindex,hh1,Dialog,Bold,12) coloured(0,128,0) DRAWLINE(barindex, hh1, barindex, hh1) endif if Wave crosses under 0 then drawtext("●",barindex,hh1,Dialog,Bold,12) coloured(128,0,0) DRAWLINE(barindex, hh1, barindex, hh1) endif if a<0 then r=128 g=0 b=0 else r=0 g=128 b=0 endif //POSITIVO IF HH>=0 and HH>HH1 and lv>lv[5] THEN SENAL=1 ENDIF IF HH>=0 AND HH<HH1 and lv>lv[5] THEN SENAL=2 ENDIF IF HH<=0 AND HH<HH1 and lv>lv[5] THEN SENAL=3 ENDIF IF HH<=0 AND HH>HH1 and lv>lv[5] THEN SENAL=4 ENDIF //NEGATIVO IF HH<=0 and lv<lv[5] THEN SENAL=-1 ENDIF IF HH<=0 and HH>HH1 and lv<lv[5] THEN SENAL=-2 ENDIF IF HH>=0 and HH>HH1 and lv<lv[5] THEN SENAL=-3 ENDIF IF HH>=0 and HH<HH1 and lv<lv[5] THEN SENAL=-4 ENDIF TIMING = SENAL if a crosses over 0 then drawtext("●",barindex,hh,Dialog,Bold,12) coloured(r,g,b) endif if a crosses under 0 then drawtext("●",barindex,hh,Dialog,Bold,12) coloured(r,g,b) endif if TIMING = 1 or TIMING = -2 then r=0 g=128 b=0 DRAWTEXT(" Timing: #TIMING# ▲",barindex,hh1,SansSerif,Bold,20)coloured(0,128,0) endif if TIMING = 2 or TIMING = -1 then r=128 g=0 b=0 DRAWTEXT(" Timing: #TIMING# ▼ ",barindex,hh1,SansSerif,Bold,20)coloured(128,0,0) endif if TIMING = 3 or TIMING = 4 or TIMING = -4 or TIMING = -3 then r=255 g=165 b=0 DRAWTEXT(" Timing: #TIMING# ▬",barindex,hh1,SansSerif,Bold,20)coloured(255,165,0) endif if Wave>=0 then rm=0 gm=128 bm=0 else rm=128 gm=0 bm=0 endif if hh>hh1 then rh=0 gh=102 bh=204 else rh=150 gh=50 bh=0 endif if hh1<hh then rh1=0 gh1=102 bh1=204 else rh1=150 gh1=50 bh1=0 endif return Wave/4 coloured (rm,gm,bm) style (histogram) as "Wave",hh coloured(rh,gh,bh) style(line,2) as "MACD",hh1 coloured(rh1,gh1,bh1)style(line,2) as "Signal", cero as "cero" |
Share this
No information on this site is investment advice or a solicitation to buy or sell any financial instrument. Past performance is not indicative of future results. Trading may expose you to risk of loss greater than your deposits and is only suitable for experienced investors who have sufficient financial means to bear such risk.
ProRealTime ITF files and other attachments :
Find other exclusive trading pro-tools on ![]()
PRC is also on YouTube, subscribe to our channel for exclusive content and tutorials


Splendid! Thanks:)
Nice job Bolsa 😉
Hola ¡¡¡ ..Muy buen trabajo, tengo una duda; en en codigo y visualmente, en ocasiones aparece : Timing: 3 – , ..esto es lo mismo, que Timing: -3?? Gracias por el indicador.
Gracias Juanjo, El Guion despues de número es pausa o indecisión de la tendencia y se da en los siguientes Timing,.
Timing : 3 –
Timing : -3 –
Timing: 4 –
Timing -4 –
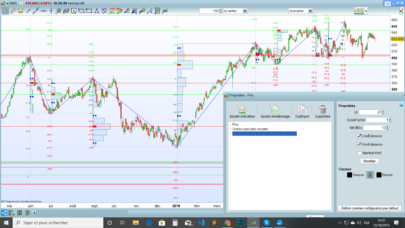
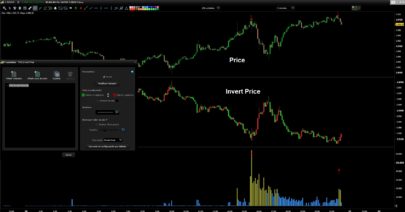
Gracias. He hecho una modificación para q aparezca en el gráfico del precio
Hay posibilidad de cambiar el Timing en el indicador, hay veces que se solapan con las medias
Seguramente es por copiar el código pon Espacios como te muestro.
” Timing:
DRAWTEXT(” Timing: #TIMING# ▲”,barindex,hh1/sd,SansSerif,Bold,20)coloured(0,128,0)
Ponle 30 Espacios entre la Comilla y el Timing:
DRAWTEXT(“——————-Timing: #TIMING# ▲”,barindex,hh1/sd,SansSerif,Bold,20)coloured(0,128,0)
reemplaza los guiones por espacios por lo que sea al copiar el texto le quita los espacios
Solucionado, gracias
Hallo Tac Bolsa,
Thanks a lot for your coding above.
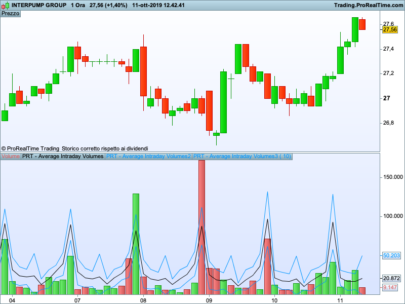
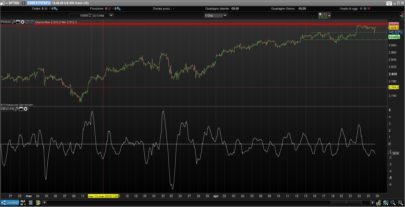
As I am personally not very charmed of the MACD (delayed crossings), I adjusted the code and deleted the MACD calculation and simply replaced it for a weighted average.(see below)
The average of the adjusted average volume seems to show good reversals of short term trends, if the average starts increasing from the lowest point, the probability of a succesful long position are reasonable. I am using it for 5 minutes trading, but also for trend watching on daily charts, and more timeframes inbetween.
The Button ADD PRT Code does not function for me, so I copied my adustment below.
///////////////////////////////////////////////////////////////////////
REM TAC Volume TEMA
////////////////////////////////////////////////////////////////////////
iter = 60 //interations
WA = 28 //wa of volume adjusted average
zero=0 //null line in graph
lv1=0
lv2=0
//Volume adjusted Average
for i= 0 to iter do
lv1=lv1+close[i]*Volume[i]
lv2=lv2+Volume[i]
next
lv=lv1/lv2
Wave = (close – lv)
TWave = weightedaverage[WA](Wave)
if Wave>=0 then // setting color red or green of histogram
rm=0
gm=128
bm=0
else
rm=128
gm=0
bm=0
endif
if TWave>=TWave[1] then // setting color red or green of histogram
ra=0
ga=128
ba=0
else
ra=128
ga=0
ba=0
endif
return Wave coloured (rm,gm,bm) style (histogram) as “Wave”, zero as “zero”, TWave coloured (ra,ga,ba) style(line,3) as “AvWave”
Thank you, Jan
Any modification is good reference if it helps us win in the market.
Hi, it seems a very useful indicator. Unfortunately the link here for the full explanation does not work https://www.tiburonesdealetacorta.com/2019/03/tac-volume-macd-timing.html //// Thanks for sharing it again. Marco
Discontinued indicator. we are sorry.
Bonjour,
je teste et j’utilise vos indicateurs depuis plusieurs années, et ils me sont devenus indispensables dans mes prises de décisions.
Merci vraiment pour votre partage;
Désireux de suivre de près la suite, est-il possible de m’autoriser à accéder à votre Blog ?
Merci beaucoup.