TTM Squeeze Pro

TTM Squeeze Pro

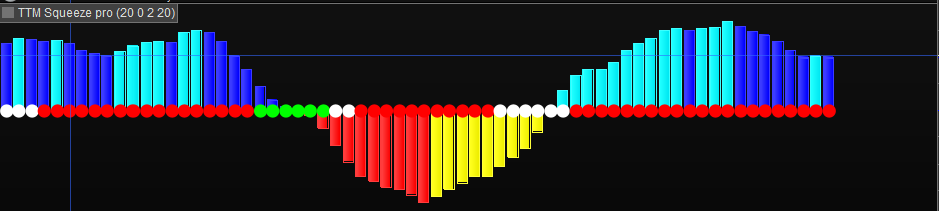
Hi guys, please find here the TTM squeeze pro. This updated version of the TTM squeeze now includes 3 levels of squeeze, low, mid and high compression rather than the previous mid squeeze only. It also includes the momentum histogram. Thanks to JS who helped with parts of the code.

Enjoy!

Share this

Risk disclosure:

No information on this site is investment advice or a solicitation to buy or sell any financial instrument. Past performance is not indicative of future results. Trading may expose you to risk of loss greater than your deposits and is only suitable for experienced investors who have sufficient financial means to bear such risk.

ProRealTime ITF files and other attachments : How to import ITF files into ProRealTime platform?

PRC is also on YouTube, subscribe to our channel for exclusive content and tutorials

  1. DELBERT • 02/16/2023 #

    Bonjour , est-il possible d’avoir un peu plus de commentaire sur les points au milieu de l’histogramme et sur l’unité de temps préférentielle , pour l’utilisation et l’efficacité de c’est indicateur SVP ? Merci . Salutations .

  2. Alfy • 02/16/2023 #

    I dont speak French but i think i understand the question. The indicator is used for volatility breakouts, the dots show when a stock/market is in a “squeeze” which means that volatility has reduced. The low squeeze is when the Bollinger bands are inside the 2 ATR Keltner channels, the mid squeeze is when the Bands are within the 1.5 ATR Keltners and the high squeeze is when the Bollingers are inside the 1 ATR Keltners. The indicator can be used in any time frame.
    2

  3. DELBERT • 02/16/2023 #

    Merci pour votre réponse .

  4. geroniman • 02/16/2023 #

    bonjour si je comprends bien, qaund els points sont verts on regarde pour un long, le blanc c’est du range, et rouge on regarde pour un short ?

  5. Alfy • 02/16/2023 #

    No, the dots only show the compression of the volatility. There are 3 levels of “squeeze” when volatility is narrowing, the white dots show the widest squeeze, the green dots show the medium compression and the blue dots the highest compression. The idea is that when volatility compresses to form a squeeze you often get an explosive breakout. To see the direction of the breakout you can use the histogram which is a linear regression of momentum. There is loads of information on the “squeeze pro” indicator on you tube if you would like to learn more about how people use it. John Carter is the creator and he has done many videos on this indicator. Best regards

  6. ted.hulsman • 348 days ago #

    Hi Alfy, I’m trying to understand your indicator, so I made the Bollinger Bands and the Keltner Channels visivle in my price charts. Do both the upper and lower BB be within the Keltner channel, or is 1 good enough? What are your setting from the KC? 2 standard deviations or 1? But if I only want to use your indicator, what’s the best way to trade with it? When red dots, “go with the flow”? So if the candle are below 0, you can stay short, when above, stay long? When dots are white, you can expect a bigger move to come (because BB are within KC). Of course a trader wants to catch a big move instead of sideways action, what is the best set-up? In other words: what’s the colour of the dot I have to look for? And if the histogram is below 0, direction of the move should be down, and when above 0 up? Thanks in advance! Greeting, Ted

avatar
Register or

Likes

avatar avatar avatar avatar avatar avatar avatar avatar avatar avatar
Related users ' posts
Fgats
6 months ago
bousalahane hello, thank you for sharing, I’m not top strong in the programation part, there is a way to...
Fgats Hi, With this indicator I just wanted to show the interest that can exist to synthesize th...
davidguerreir how to adapt nbStdSig values ?
FXtonio @RICOU en 1 minutes avec un filtre de tendance ZLSMA 200 et eventuellement un rsi 7 , 69% de...
JC_Bywan For people interested in the screener: https://www.prorealcode.com/topic/screener-buy-sell-m...
octum Gracias NJicolas. Las lineas 35 y 36 dan fallo. (¿Es adrede para iniciados?) Puedes co...
bab el franco hello once installed I have no results despite different options of markets or temporality
Nicolas Sorry there was a small issue in the code, i have changed the attached itf file and updated ...
Mitchy14 Hi Nicholas, apologies, I am usually fairly good at implementing your creations (for which I...
Nicolas Are you using PRT version pre-v11? TIMEFRAME for indicators is possible since months for pro...
Nicolas Merci d'ouvrir un sujet dans le forum des screeners en respectant les règles de publication ...
Pensera Bravo Nicolas ! Tu es en quelque sorte l’inventeur de Metascore…(oups je viens de lire jusqu...
Nicolas Dans un but d'investissement pure, et non spéculatif.
Fabian Hi Thomas, thanks for your explanations. Which indicator do you use in the screenshot ...
Thomas Thats On Balance Volume and Bollinger or SMA or what you want. It shows me the volume flow. ...
bertrandpinoy @MAKSIDE I would be grateful if you send me your version. have a nice day
oraclus Bonjour indicateur très intéressant existe t il un screener qui détecte les actions qui donn...
IV Mcm Ce n'est pas le but de cet indicateur, mais avec un peu d'entraînement vous pourriez le code...
Yantra Thank you for sharing your good work!
imonix Have been trying this on demo since Monday before deciding whether to go live with it. Using...
Roberto Blázquez I'm sorry, I've tried it since November 2012 and it's bad results.
Dunstan I would like to get guidance_ How do I access and attach this indicator to my MT5 platform...
Nicolas You can't, use prorealtime, it's way better
jc84 Thank you very much for this indicator , not provided by PRT I was actually working at thi...
Pierreco1991 Hello Can you confirm this configuration for FRANCE ? //Time in UTC+8 Rest0Minutes =...
Nicolas Ask on an Excel website?!
JJMR HOLA NICOLAS, TENGO LA ULTIMA VERSION ACTUALIZADA DEL INDICADOR TTM SQUEEZE PRO EN LA VERSIO...
imokdesign @nicolas ,if in want to "call" this indicator, which values i have to write down?
supertiti Bonjour Nicolas, Je ne comprend pas bien , le trend change de couleur quand les prix sont a...
Nicolas Oui ce serait possible, cependant l'indicateur est bien prévu pour conserver la couleur de l...
supertiti Quand tu pourras si tu peux nous coder la troisième couleur cela améliorerait les trades cou...
Zigo Normaly it do work in version 11.
bertrandpinoy Hello to all, please does a coder can bring the indication of the price level on the chart o...
Zigo @bertrandpinoy add between line 50 and 51 : drawtext("#dnh#",barindex,low-2.618*AverageTrue...
supertiti Hello Jan You must use this code in correspondence with other indicators, a code alone do...
Franro Hi, this looks very good is this something you worked towards a strategy?
hua hin Bonjour comment mettre ce programme sur un graphique le lien est en JPG et sur crewation i...
Bard I've also just noticed that changing the "Bands Deviation" setting from 1.25 to eg 3 doesn't...
bartekz Hi @Nicolas, Really impressed by your work. I am trying to replicate the Wave-PM indicator t...
Nicolas You don't have to replicate it, download the file and import it into your platform.
Marie-Eve Vergoz lorsque je copie les codes, le système me signale des erreurs à la ligne 12 et suivantes
Marie-Eve Vergoz sorry - tout est ok -

Top