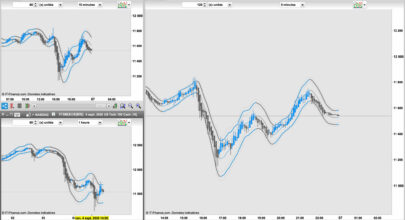
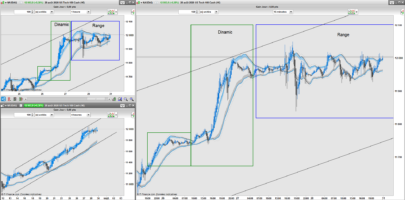
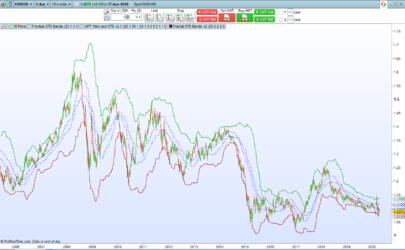
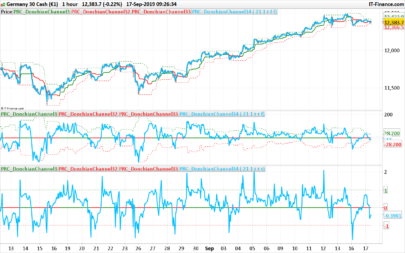
Here is the code for the linear regression channel of standard deviation and standard error. It is the same one than the tools of the platform.
You can change the lookback period which correspond of the amount of candlesticks for the linear regression calculation.
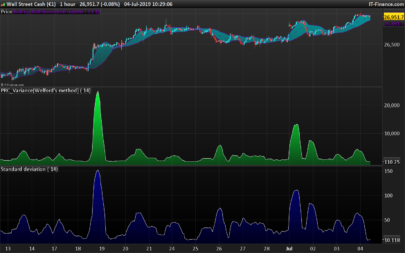
The ChannelType setting is used to change the calculation type of the upper and lower channel between the standard deviation and the standard error. You can also change the deviation multiplier which is set to 1 by default.
|
1 2 3 4 5 6 7 8 9 10 11 12 13 14 15 16 17 18 19 20 21 22 23 24 25 26 27 28 29 30 31 32 33 34 35 36 37 38 39 40 41 42 43 44 45 46 47 48 49 50 51 52 53 |
//PRC_Std and Ste LinRegChannel | indicator //Standard Deviation and Standard Error //Linear Regression Channel //12.03.2019 //Nicolas @ www.prorealcode.com //Sharing ProRealTime knowledge defparam drawonlastbaronly=true defparam calculateonlastbars=1000 // --- settings lookback= 200 //channel period ChannelType = 1 //1= Standard Deviation ; 2= Standard Erro NbDeviation = 1 //Deviation multiplier colorRed = 255 colorGreen = 255 colorBlue = 0 // --- end of settings sumx = 0 sumy = 0 sumxy = 0 sumx2 = 0 for cmpt = lookback downto 0 do tmpx = cmpt tmpy = close[cmpt] sumy = sumy+tmpy sumx = sumx+tmpx sumx2 = sumx2 + (tmpx*tmpx) sumxy = sumxy + (tmpy*tmpx) next n = lookback+1 if (sumx2 = sumx * sumx) then // protection to avoid infinite values b = sumxy - sumx * sumy else b = (n * sumxy - sumx * sumy) / (n * sumx2 - sumx * sumx) endif a = (sumy - b * sumx) / n drawsegment(barindex[lookback],a+b*lookback,barindex,a+b*0) coloured(colorRed,colorGreen,colorBlue) //channel if ChannelType = 1 then //Standard Deviation dat = std[lookback]*NbDeviation else dat = ste[lookback]*NbDeviation endif drawsegment(barindex[lookback],(a+b*lookback)+dat,barindex,a+b*0+dat) coloured(colorRed,colorGreen,colorBlue) drawsegment(barindex[lookback],(a+b*lookback)-dat,barindex,a+b*0-dat) coloured(colorRed,colorGreen,colorBlue) return |
Share this
No information on this site is investment advice or a solicitation to buy or sell any financial instrument. Past performance is not indicative of future results. Trading may expose you to risk of loss greater than your deposits and is only suitable for experienced investors who have sufficient financial means to bear such risk.
ProRealTime ITF files and other attachments :
Find other exclusive trading pro-tools on ![]()
PRC is also on YouTube, subscribe to our channel for exclusive content and tutorials


Very helpful! Thank you Nicolas
Thanks again Nicolas. My question is, how can I set a general delay to make backtests: for example, to set the standard lookback of 200 but starting x bars before and ending also x bars before. I want to see how this indicator behaves depending of the time, to define strategies for buying and selling. Lookback should be the same, only delayed on the time.
And the other question is how to set an automatic trading herewith: as the lines are segments, I cannot define my strategy like “IF close > upperband THEN SELL..”
Just add a linear regression moving average of 200 periods on the chart and you’ll get the same.
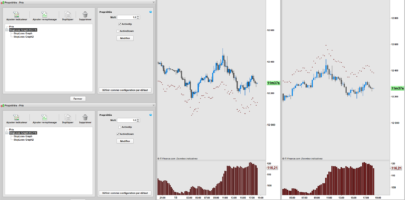
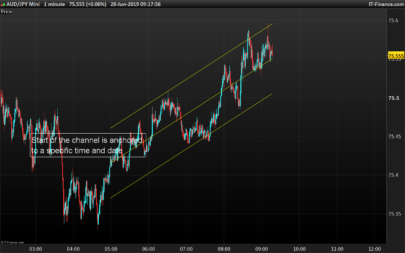
Hello Nicolas, this is great, however the actual PRT standard error and standard deviation channels keep on plotting themselves keeping the starting bar fixed and changing with the new bar dynamically. Do you have a code for these 2 dynamic channels please? Many thanks.
If you want to anchor the channel to a specific candlestick, that would be possible but with custom coding. Please open a new topic in the ProBuilder forum and ask your question there, with as much details as possible. Thanks in advance.
Would it be possible to modify this so it drew each bar one at a time? So with say 3 dots per candle (top, middle & bottom), rather than a line between start-finish? To see where each candle stands independently.
Hallo. Sehr guter Trendline Indikator. Ich würde gerne die Linien dicker haben. Kann mir jemand sagen was ich beim Indikator ändern kann damit diese dicker und grösser werden? Danke.
Es ist in prorealtime v10.3 nicht möglich, sorry 🙂
Wenn Sie v11 verwenden, können Sie möglicherweise STYLE (line,2) am Ende jeder DRAWSEGMENT-Zeile hinzufügen
Hello, is it possible to use this channel in a strategy? i tried to apply in a code but the value of the channel change like a normal bollinger band not like a channel.
Because this is indeed nothing more of what you describe. A mean with +/- standard deviation is known as the Bollinger Bands. A standard deviation channel is a projection in the past of a least square moving average with upper and lower lines made with STD or STE multiplied by a factor.
std and ste returns 0 on a call… how can i calculate it in a call?
okay i got it “ste[lookback](close)” “(close)” was missing.
Ciao Nicolas, e possibile fare uno screener con questo codice ovvero vorrei sapere quando il prezzo esce dal canale sia sulla parte superiore che inferiore.
Grazie mille
https://www.prorealcode.com/topic/screener-regressione-canale/
Hi Nicolas,
Fantastic work, I’m really grateful for this. I was wondering if it would be possible to remove (or make transparent) the middle line. Could you please let me know what code should I add to the indicator code to make this happen? Thank you very much.