







Scalper trade signals John Carter
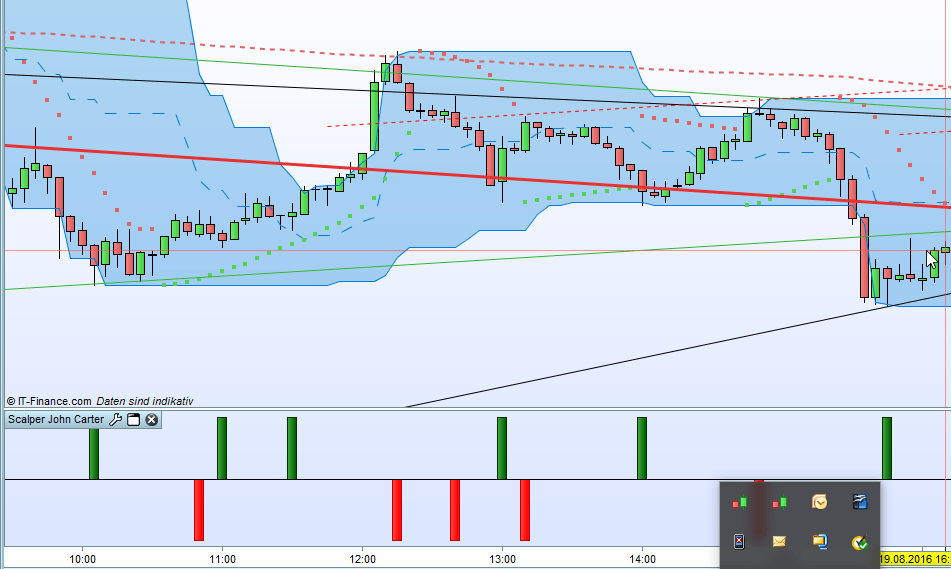
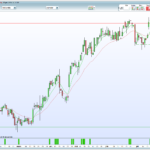
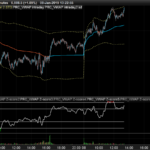
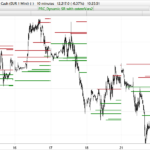
Buy and Sell signals made of the John Carter’s scalper indicator.
once rr=1
mb=average[20](typicalprice)
k=48
n=(k*2)-4
p=(n/2)-1

h1=DPO[n](high)

moyh=high-h1
hi=(moyh-moyh[1]+(high[p])/n)*n
hi=(round(hi*100))/100
l1=dpo[n](low)

moyl=low-l1
lo=(moyl-moyl[1]+(low[p])/n)*n
lo=(round(lo*100))/100
clo1=dpo[n](close)

moyc=close-clo1
clot=(moyc-moyc[1]+(close[p])/n)*n
clot=(round(clot*100))/100
cond1=(high>high[1] and high>high[2])
cond2=(cond1 and high>hi[46]) and (barindex>bari or rr=-1)
if cond1 and cond2 then
flagg=1
targeth=high
targetl=lo[46]
else
flagg=0
signa=mb
endif
for zz=0 to 45
if clot[45-zz]<targetl and hi[45-zz]<=targeth and flagg=1  then
signa=high+(averagetruerange[20](close))*.5
rr=1
bari=barindex+zz+2
break
elsif     hi[45-zz]>targeth then
signa=mb
break
endif
next
condi=(low<low[1] and low<low[2]) and low<lo[46] and (barindex>bar or rr=1)
if condi then
fflag=1
target1=low
target2=hi[46]
else
fflag=0
siigna=mb
endif
for kk=0 to 45
if clot[45-kk]>target2 and lo[45-kk]>=target1 and fflag=1 then
siigna=low-(averagetruerange[20](close))*.5
rr=-1
bar=barindex+kk+2
break
elsif lo[45-kk]<target1 then
siigna=mb
break
endif
next
if barindex < 100 then
signa=undefined
siigna=undefined
endif
golong = (siigna < mb)
goshort = (signa > mb)*-1
return golong as  "LONG",goshort as "SHORT",0
Comments
You must be logged in to post a comment.




salve, ho provato ad usarlo su grafico 1 minuto .. non si aggiorna .. i segnali non si vedono ... bisogna ricaricare l'indicatore per vedere i segnali nuovi..
hi, I tried to use it on chart 1 minute .. does not update .. the signals are not seen ... you have to reload the indicator to see the new signals ..
Hi,
I am new to FX trading, have been following this website for sometime and also learning pro real code. Since I am using Pro Real time 10.2, I had to convert the above code into screener. I extracted the LONG signal related code from above and created a LONG screener and did the same for SHORT screener. The LONG signal code returns data however the SHORT signal doesn't, not sure what is wrong with the code. Can you please help? Below is the SHORT signal code, everything is the same from above except for screener keyword at the end.
once rr=1
mb=average[20](typicalprice)
k=48
n=(k*2)-4
p=(n/2)-1
h1=DPO[n](high)
moyh=high-h1
hi=(moyh-moyh[1]+(high[p])/n)*n
hi=(round(hi*100))/100
l1=dpo[n](low)
moyl=low-l1
lo=(moyl-moyl[1]+(low[p])/n)*n
lo=(round(lo*100))/100
clo1=dpo[n](close)
moyc=close-clo1
clot=(moyc-moyc[1]+(close[p])/n)*n
clot=(round(clot*100))/100
cond1=(high>high[1] and high>high[2])
cond2=(cond1 and high>hi[46]) and (barindex>bari or rr=-1)
if cond1 and cond2 then
flagg=1
targeth=high
targetl=lo[46]
else
flagg=0
signa=mb
endif
for zz=0 to 45
if clot[45-zz]<targetl and hi[45-zz]<=targeth and flagg=1 then
signa=high+(averagetruerange[20](close))*.5
rr=1
bari=barindex+zz+2
break
elsif hi[45-zz]>targeth then
signa=mb
break
endif
next
condi=(low<low[1] and low<low[2]) and low<lo[46] and (barindex>bar or rr=1)
if condi then
fflag=1
target1=low
target2=hi[46]
else
fflag=0
//siigna=mb
endif
for kk=0 to 45
if clot[45-kk]>target2 and lo[45-kk]>=target1 and fflag=1 then
//siigna=low-(averagetruerange[20](close))*.5
rr=-1
bar=barindex+kk+2
break
elsif lo[45-kk]<target1 then
//siigna=mb
break
endif
next
if barindex < 100 then
signa=undefined
//siigna=undefined
endif
//golong = (siigna < mb)
goshort = (signa > mb)*-1
SCREENER[goshort] (Variation AS "%Chg prev bar")

merci pour ta reponse nicolas
loin de moi cet idée je souhaite juste apprendre et ne veux pas utilisé une autre formule de DPO mais simplement une version temps réel pour fixé les signaux je souhaite l utilisé en complément d une strategie mais pas avec des faux signaux.
j ai trouvé ça qui pourrai le remplacer
study(title="TTM scalper indicator", overlay = true)
width = input(2, minval=1)
triggerSell = iff(iff(close[1] < close,1,0) and (close[2] < close[1] or close[3] <close[1]),1,0)
triggerBuy = iff(iff(close[1] > close,1,0) and (close[2] > close[1] or close[3] > close[1]),1,0)
buySellSwitch = iff(triggerSell, 1, iff(triggerBuy, 0, nz(buySellSwitch[1])))
SBS = iff(triggerSell and buySellSwitch[1] == false, high, iff(triggerBuy and buySellSwitch[1], low, nz(SBS[1])))
clr_s = iff(triggerSell and buySellSwitch[1] == false, 1, iff(triggerBuy and buySellSwitch[1], 0, nz(clr_s[1])))
clr = iff(clr_s == 0 , green , red)
plot(SBS, color=clr, title="TTM", style = circles, linewidth = width)
je vais tenter de recodé pour m entrainé sinon comment ferai tu pour la modif version temps réel que je meurt pas idiot lol.
merci

L'utilisation du DPO dans cet indicateur n'est utile que pour obtenir des données du futur et ainsi donner à l'indicateur une allure parfaite. C'est une utilisation déviée du DPO par l'auteur pour compenser le fait que la plateforme ne lit qu'une seule fois l'historique. En aucun cas un DPO n'est utile pour calculer une régression linéaire, donc utiliser une autre formule du DPO pour utiliser cet indicateur en trading automatique est inutile et une perte de temps :)

Bonjour.
Est-il possible d'enrichir cet indicateur en lui ajoutant un histogramme à 0.5 dans le sens du dernier signal obtenu.
Par exemple, un signal vert apparaît. Tant qu'aucun signal rouge n'apparaît, faire apparaître un histogramme achat positif à 0.5.
On aurait ainsi Histogramme vert +1 au signal, histogramme bleu à 0.5 tendance achat et histogramme rouge -1 signal vente et rose -0.5 tendance vente.


ah okay, thats the reason why the backtest is so great!
Why is the Indicator changing when i refresh my charts? Sometimes there is a signal and when i reload the chart the signal is no more there....kind of confusing...



Hello
Quelqu'un peut m'aider à introduire du texte sur l'histogramme, je n'y parvient pas ! ça doit être quelque chose comme cela mais le placer où ?
merci de votre aide
If  golong = (siigna < mb)   then
DRAWTEXT ( "G " ,barindex,- 0.5,dialog,standard,20) coloured ( 49,49,220 )
endif


If  goshort = (signa > mb)*-1 then
DRAWTEXT ( "G " ,barindex,- 0.5,dialog,standard,20) coloured ( 49,49,220 )
endif

This code is from HK-LISSE website and can be found here: http://hk-lisse.over-blog.com/article-21382754.html
Bard added histogram signals to this original code and has gently proposed it to the Library.
Because of use of the DPO with future informations, this indicator do "repaint". I know some people use it even if it is the case. So here it is.


I have tested this indicator , this is one of the best indicator for scalping , I tested on 3 min and 10 min works excellent