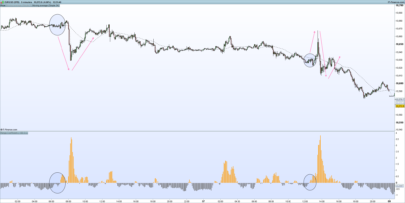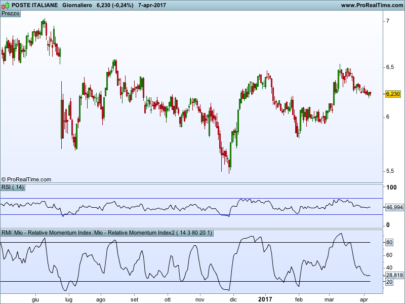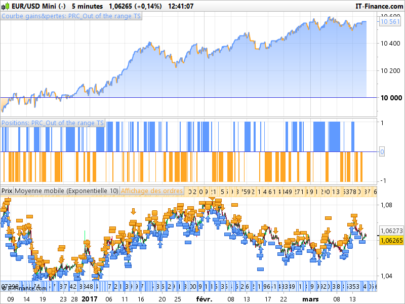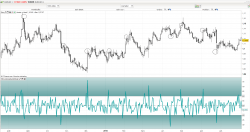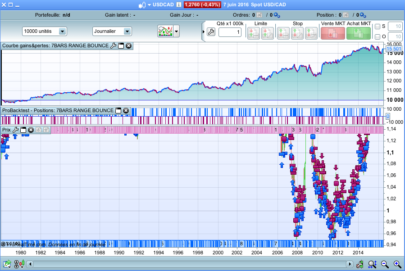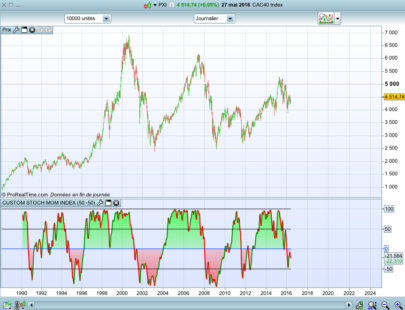
The range expansion index (REI) is a technical indicator used in the technical analysis of financial markets. It is intended to chart the relative strength or weakness of a trading vehicle based on the comparison of the recent price changes and the overall price changes for the period.
The REI can be classified as a momentum oscillator, measuring the velocity and magnitude of directional price movements. The REI shows overbought/oversold price conditions by measuring the relation between the sum of “strong” price changes (such that form a trend) and all price changes for the period.
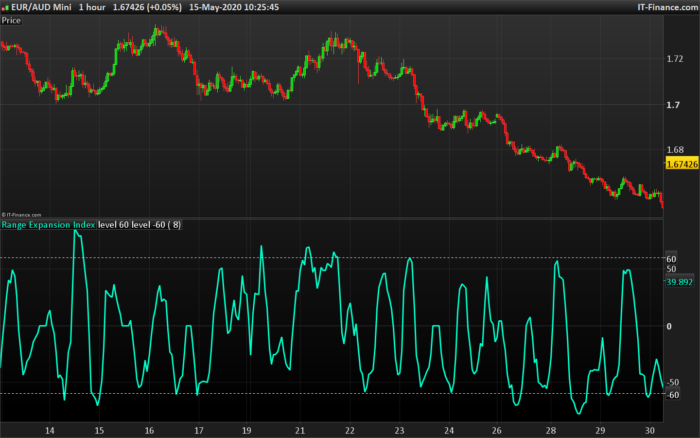
The REI is most typically used on an 8 day timeframe. It changes on a scale from −100 to +100, with the overbought and oversold levels marked at +60 and −60, respectively.
The range expansion index was developed by Thomas DeMark and published in his 1994 book, The New Science of Technical Analysis.
(source Wikipedia).
|
1 2 3 4 5 6 7 8 9 10 11 12 13 14 15 16 17 18 19 20 21 22 23 24 25 26 27 28 29 30 31 32 33 34 35 36 37 38 39 40 |
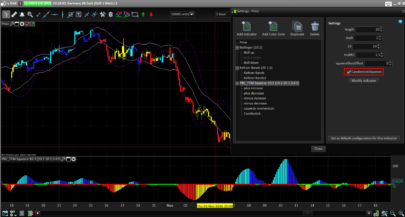
//PRC_RangeExpansionIndex | indicator //15.05.2020 //Nicolas @ www.prorealcode.com //Sharing ProRealTime knowledge // --- settings REIPeriod = 8 // --- end of settings diff1 = High - High[2] diff2 = Low - Low[2] if ((High[2] < Close[7]) and (High[2] < Close[8]) and (High < High[5]) and (High < High[6])) then numzero1 = 0 else numzero1 = 1 endif if ((Low[2] > Close[7]) and (Low[2] > Close[8]) and (Low > Low[5]) and (Low > Low[6])) then numzero2 = 0 else numzero2 = 1 endif subvalue = (numzero1 * numzero2 * (diff1 + diff2)) AbsDailyValue = Abs(diff1)+Abs(diff2) SubValueSum = 0 AbsDailyValueSum = 0 for j = 0 to REIPeriod-1 do SubValueSum = SubValueSum+SubValue[j] AbsDailyValueSum = AbsDailyValueSum+AbsDailyValue[j] next if (AbsDailyValueSum <> 0) then REI = SubValueSum / AbsDailyValueSum * 100 else REI = 0 endif return REI as "Range Expansion Index", 60 style(dottedline) as "level 60", -60 style(dottedline) as "level -60" |
Share this
No information on this site is investment advice or a solicitation to buy or sell any financial instrument. Past performance is not indicative of future results. Trading may expose you to risk of loss greater than your deposits and is only suitable for experienced investors who have sufficient financial means to bear such risk.
ProRealTime ITF files and other attachments :
Find other exclusive trading pro-tools on ![]()
PRC is also on YouTube, subscribe to our channel for exclusive content and tutorials