
Hello everyone,
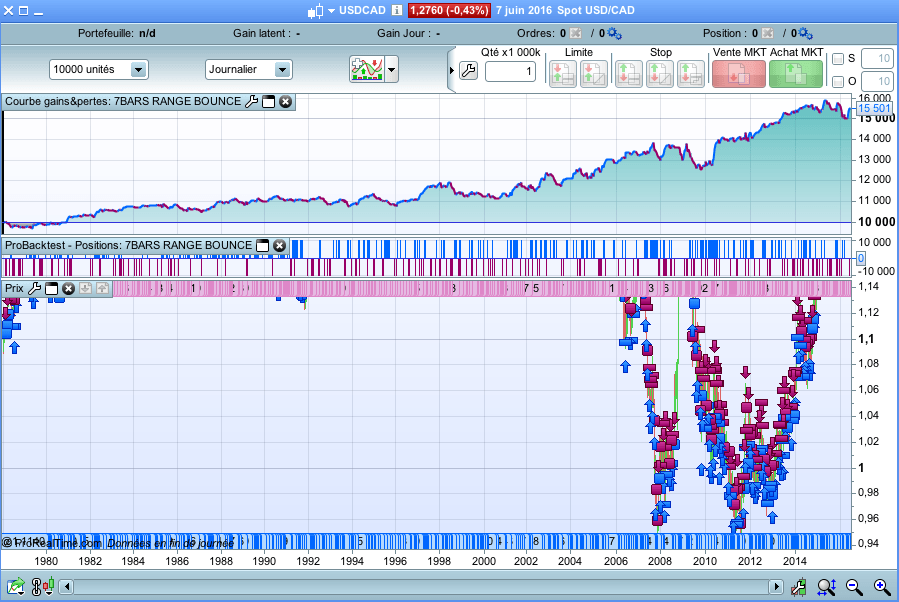
Here’s a little strategy of my own. Actually, I wanted to test the breakout of a range defined by a number of candles, and I’ve realized that the rebound was more profitable.
How does the strategy work ?
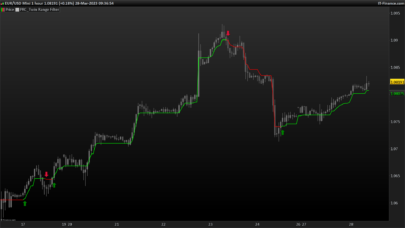
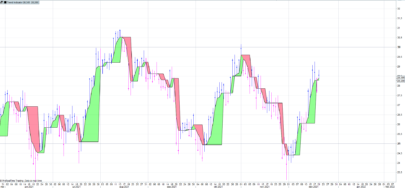
We consider a bar signal if its amplitude (high – low) is less than the amplitude of each of the previous 6 bars. In this case, we place two orders :
- “buy limit” at the lowest of the last 6 previous candles
- “sell limit” at the highest of the last 6 candles.
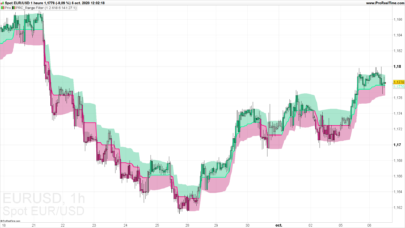
This means that we play the bounces between the high and the low of the range.
The take profit is set at the middle the range, the stop loss is equal to the take profit.
By changing the parameters, you could have a backtest with a “perfect” equity curve.
It nearly always mean that the stop loss and take profit are often on the same candle, and in this case the backtest record only the take profit. I hope ProRealTime will soon fix this issue.
But for these parameters, it seems to work well.
|
1 2 3 4 5 6 7 8 9 10 11 12 13 14 15 16 17 |
Defparam cumulateorders = false n = 10 RANGE7 = high - low < high[1] - low[1] and high - low < high[2] - low[2] and high - low < high[3] - low[3] and high - low < high[4] - low[4] and high - low < high[5] - low[5] and high - low < high[6] - low[6] IF RANGE7 THEN HAUT = highest[6](high) BAS = lowest[6](low) amplitude = haut - bas buy n shares at BAS limit sellshort n shares at HAUT limit ENDIF set stop loss amplitude/2 set target profit amplitude/2 |
Share this
No information on this site is investment advice or a solicitation to buy or sell any financial instrument. Past performance is not indicative of future results. Trading may expose you to risk of loss greater than your deposits and is only suitable for experienced investors who have sufficient financial means to bear such risk.
ProRealTime ITF files and other attachments :
Find other exclusive trading pro-tools on ![]()
PRC is also on YouTube, subscribe to our channel for exclusive content and tutorials
Hi @Doc. What costs/spread did you include in your test? Does the strategy work on anything else?
Hello,
The strategy should be improved, no doubt. But it was just one of my ideas, which had to be tested.
It’s not one of the strategies that I use. My personnal strategies are far far better (+20 to 35% each year, < half drawdown, with profit factor 2 to 4), and are used on indexes or stocks.
I find that it is VERY difficult to get good strategies on forex, it’s far easier on stocks market / indexes.
I’m still looking for trying to create a good strategy on forex… but I didn’t get it yet.
Regards,
Yes Nicolas is very difficult, macro economic data can destroy any work!!
depends which.. I personally think that it’s much more easier to trade on XBTUSD, try to construct a strategy on crypto! 🙂