Pivot Support/Resistance Zones

v10.3
Pivot Support/Resistance Zones

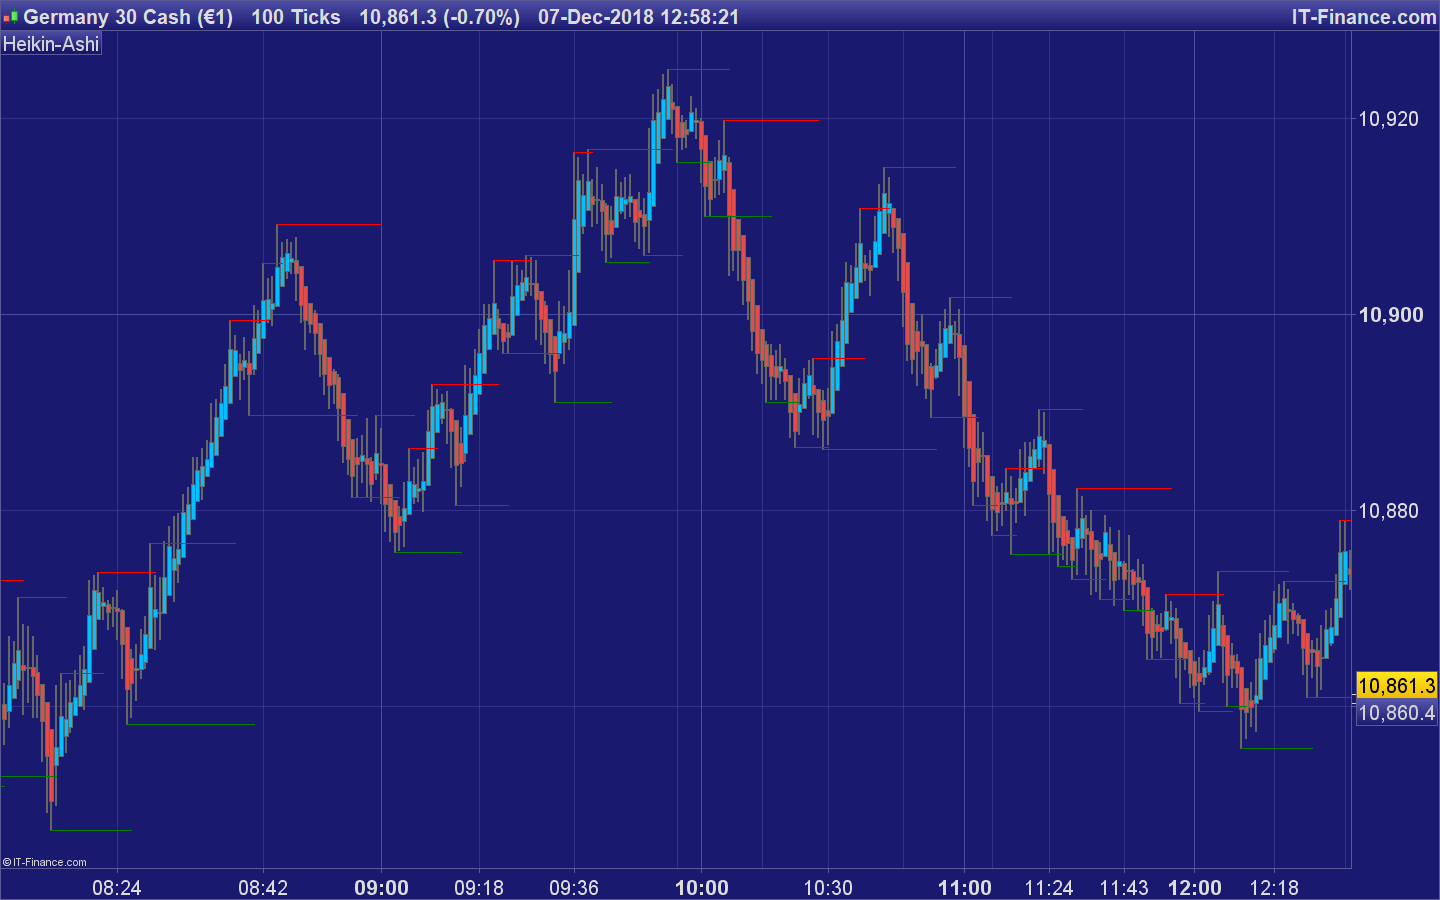
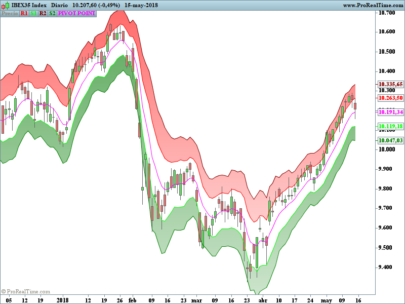
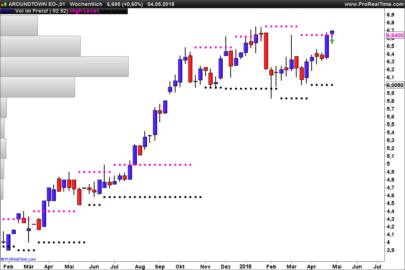
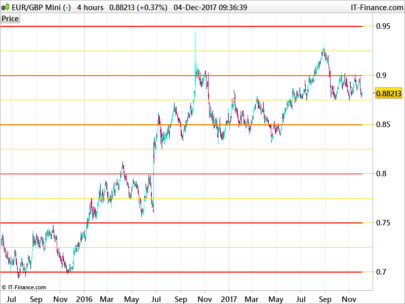
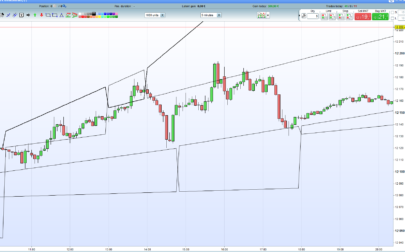
This indicator plots levels of support/resistance calculated with high/low pivot points:

At a price bar preceded by 4 higher lows and followed by 2 higher lows, a new support line is found and green line is starting. It starts at the lowest low and stops until the line is later crossed or when a new support is formed later.

The same for a red resistance line at a price bar with 4 lower Highs before and followed by 2 lower Highs.

The code has been made following a request in the ProBuilder forum.


Share this

Risk disclosure:

No information on this site is investment advice or a solicitation to buy or sell any financial instrument. Past performance is not indicative of future results. Trading may expose you to risk of loss greater than your deposits and is only suitable for experienced investors who have sufficient financial means to bear such risk.

ProRealTime ITF files and other attachments : How to import ITF files into ProRealTime platform?

PRC is also on YouTube, subscribe to our channel for exclusive content and tutorials
  1. rama • 12/07/2018 #

    This is one of best indicator to trade any time frame

  2. Madrosat • 12/07/2018 #

    Is this indicator as it is , useful in strategy automatic

  3. Vangotten • 12/07/2018 #

    Muy buen indicador

  4. s00071609 • 12/07/2018 #

    Hi Roberto
    I am trying to use this indicator but once i import the itf file. the indicator gets imported but when i apply it to chart – it does not plot to the price chart rather it takes the space under the chart like Oscillators.
    Could you please suggest what I am doing wrong.

    • robertogozzi • 12/07/2018 #

      Click the wrench on the upper left corner of your chart, then select PRIICE on the left and click ADD INDICATOR and then again select the indicator of your choice.

  5. s00071609 • 12/07/2018 #

    thanks now its working

  6. s00071609 • 12/07/2018 #

    How would it be possible to call the Last Support Price and the Resistance Price from strategy?

    • robertogozzi • 12/07/2018 #

      Replace RETURN with RETURN SupportPrice,ResistancePrice.
      When you CALL they will be returned in the same order you have written them next to RETURN, as you can easilysee from documentation and the many indicators and code snippets on these forums.

  7. s00071609 • 12/07/2018 #

    Great thank you

  8. Bard • 12/07/2018 #

    Thanks for this great indicator @Robertogozzi, I wondered if it was possible to make an exponential average band version? I tried to make 2 period EMA’s of the SupportPrice and ResistancePrice which almost works except for the bands lag behind the high resistance and low support areas. Cheers.

    • robertogozzi • 12/07/2018 #

      You can find it at https://www.prorealcode.com/topic/pivot-support-resistance-bands/.
      I hope it’s what you wanted.

    • Bard • 12/07/2018 #

      Yes, thanks, appreciated.

  9. mscharstrom • 12/07/2018 #

    Hi @robertogozzi,

    I really love this indicator. However, I’d like to tinker with it to fit my needs a bit better.
    I am new to ProRealCode (and ProRealTime) in general, hence I’m having some issues getting it to where I want.

    Please see this image:
    https://imgur.com/a/Lwk2nvS

    Would it be possible to alter the code so that it would draw rectangles as my image? Only on new highest high and lowest low. Potentially merging if two lines are “close” to each other. In the image attached, one example would be 1531 to 1527 (since 1531 and 1531 are so close to each other).

    I love drawing out resistance/support levels like this, but it would of course save me lots of time if it could be done automatically. Would appreciate your input greatly and if you could point me in any direction.

    In the best of worlds, I would later add so that it could draw boxes based on consolidation some patterns.

    Kindest regards

  10. Ahimsa • 12/07/2018 #

    Hi Roberto

    I cannot thank you enough for writing this code. It could help me more than you know.

    I have the same problem as another poster though in that I can’t add it to the chart. It comes up as an oscillator below the price chart. I don’t even appear to have a ‘wrench’ in the top left corner in order to sort this out.

    Best wishes Ahimsa

    • Nicolas • 12/07/2018 #

      With PRT v11, you have to click on “price” at the upper left side of the price chart.

avatar
Register or

Likes

avatar avatar avatar avatar avatar avatar avatar avatar avatar avatar avatar avatar avatar avatar avatar avatar

+15 more likes

Related users ' posts
Nicolas Please open a new forum topic, and respect the posting rules. Add a precise description of w...
FXTT ok will do, apologies, as I said I am new here. many thanks
Noobywan Version v2 including requested additions: https://www.prorealcode.com/prorealtime-indicators...
Trading_En_El_Ibex35 Para calcular el punto pivote y los niveles de soporte y resistencia para operar durante la ...
supertiti Hola mis disculpas, creia que tu eres Jose Antonio Madrigal ! gracias por las explicaci...
Trading_En_El_Ibex35 espero que las explicaciones te hayan sido de ayuda saludos
Paul Thanks for posting. I was currently searching how to improve day-trading based on support an...
Jessar Könntest du im Forum etwas öffnen und später darüber zu sprechen?
arahussein Hi All, I am new to trading and i find this indicator very logicail! Hence my (dumb?) quest...
Leo Hi all, I posted a new version of this indicator ( I just add arrows to spot the local maxi...
Trading_En_El_Ibex35 Muchas Gracias por compartir este interesante indicador. Un saludo
xavieralava hola gracias leo
Nicolas https://www.prorealcode.com/topic/ayuda-screener-indicador-perfect-trend-line/#post-51291
Manu L. Bonjour Nicolas, suite a une de mes precedentes demande dans le forum indicateur, j'ai touv...
AntoGH C'est selon moi le meilleur indicateur, que j'ai vu, si vous trouvez mieux dîtes moi car dif...
gblast I added this indicator to my pro real time but its not showing up on my candles. Its invisible
juanj And the point of violation is the close of the candle that violates the line by generating a...
juanj For the latest version of the strategy or to follow updates and developments see the thread ...
phanz i backtested it with 10K units of EURUSD 1 hour i get an equity curve that is going one way ...
Wing Not yet but I plan to.
Leo Have a look in this Forum, I got something interesting for you... https://www.prorealcode.co...
Dávid Gyalus Dear Wing, As I am a daytrader, and one of my best friend is a programmer we think your a...
Nicolas Questo indicatore è stato progettato solo per i dati intraday, ma potrebbe essere adattato a...
MrCrous //FR Bonjour, Dans le code ci dessus, je ne comprends pas ce que fait la ligne : linea...
Nicolas J'ai déjà répondu à cette question quelque part sur le forum. Il faudrait chercher un topic ...
Nicolas No sorry, please use this file instead into a prorealtime trading platform.
rdabbs I just installed this indicator. It opens in its own pane rather than overlaid on the chart ...
Nicolas Just apply it on your price chart instead and you're ok.
Samitha Prasanna Hi ALE, would you be able to provide the values for the below part of the code (time >=1...
Player Bonjour, J'ai testé cette stratégie sur EurUSD en 1 heures sur 10000 unités et le résultat ...
Player Vue du rapport du Backtest https://ibb.co/8BMrBz6
owes29 Hi is there anyway to develop this for the pro scanner on daily or hourly scans. so it woul...
Nicolas Of course, please add a query in the proscreener forum.
Bruno Carnazzi C'est dommage, cette histoire d'énergie fractale bousille complètement la précision de l'ind...
Wing Yes, investigate as much as you want. For more insight, you can view the linet1, linet2 etc....
CKW Hi Wing, Thanks for your sharing. I am still trying to breakdown & understand your code...
Wing Hello CKW. No, the parameter, 7 in this case, is used when calling the RSI indicator to ide...
dakaodo Hi, Wilko. Acc to the original FRAMA paper by Ehlers, Ehler's own code only takes inputs for...
dakaodo For reference, here is Ehlers' original paper: http://www.mesasoftware.com/papers/FRAMA.p...
dakaodo Here is the code with only SC included, per ETFHQ. pri=customclose //len>=4, even on...
Nicolas
7 years ago
haseluis Hello Niklas, I would like to use the screener for the display in the m15, which changes to ...
Nicolas Nothing to change or you can play with different settings at lines 6 and 7.
haseluis Thank you Niklas, I'm still looking for an indicator 123 or direct to Joe Ross, can you help...
juju333 Merci Nicolas, j'utilisais avec bonheur ce code dans la 10.3, il ne tourne plus dans la v11....
Nicolas Remplacer les lignes 11 et par 12 avec: yearlyHigh = Highest[max(1,BarIndex - lastYearBarI...
juju333 merci !!!
zilliq Be careful, It works only if you are in daily timeframe, and on your graphic you are on hou...
DerPat I guess you are right, like always. If you change n to 24 you have at least the hours of a d...
gabri DerPat, you can also change line1 to read as follow to adapt this script to hourly timefram...
roos Hi Nicolas, another really helpful bit of code, thank you! Can I ask how you might amend so ...
Denis Good evening Nicolas, could you tell me where thae arrows on the chart come from ? I don't s...
Nicolas there is no arrow in this indicator.
Nicolas
8 years ago
Nicolas add it on price chart, change the cp parameter according to the period you want to observe f...
Robert22 hola buenos días: yo estoy buscando una cosa parecida para realizar con ello un indicador de...
Nicolas https://www.prorealcode.com/prorealtime-indicators/rsi-classical-hidden-divergences-indicator/
Grantx When I add this code, the indicator appears in the panel below price. How do I get it to dis...
Patrik72 Hello, thank you very much for the great indicator. One question, is it possible just have l...
datageek is it possible to add Mid pivot points (midR1 and MidS1)?

Top