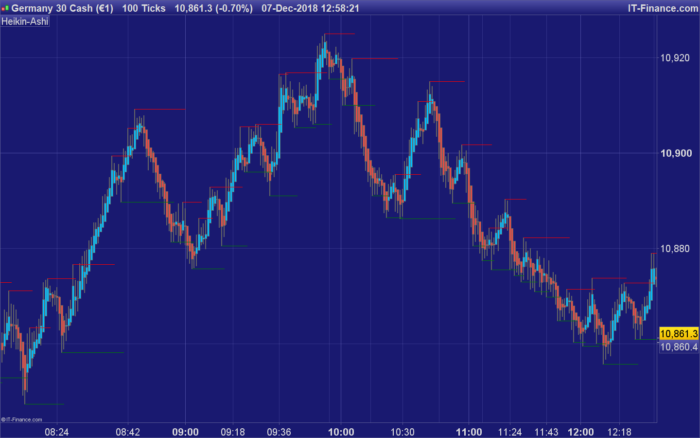
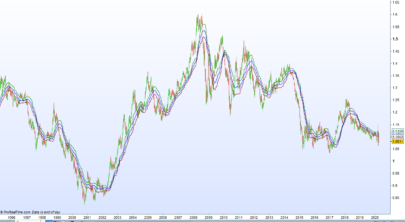
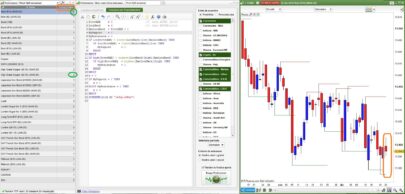
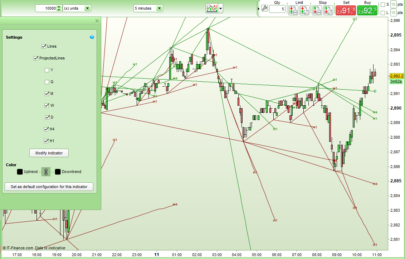
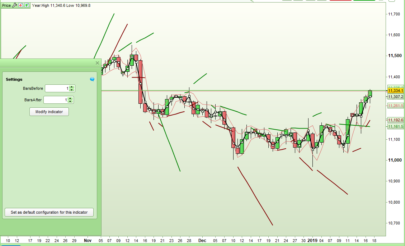
This indicator plots levels of support/resistance calculated with high/low pivot points:
At a price bar preceded by 4 higher lows and followed by 2 higher lows, a new support line is found and green line is starting. It starts at the lowest low and stops until the line is later crossed or when a new support is formed later.
The same for a red resistance line at a price bar with 4 lower Highs before and followed by 2 lower Highs.
The code has been made following a request in the ProBuilder forum.
|
1 2 3 4 5 6 7 8 9 10 11 12 13 14 15 16 17 18 19 20 21 22 |
DEFPARAM CalculateOnLastBars = 1000 PivotBAR = 2 //2 bars AFTER pivot LookBack = 4 //3 bars BEFORE pivot BarLookBack = PivotBAR + 1 IF low[PivotBAR] < lowest[LookBack](low)[BarLookBack] THEN IF low[PivotBAR] = lowest[BarLookBack](low) THEN MySupport = BarIndex - PivotBAR SupportPrice = low[PivotBAR] ENDIF ENDIF IF high[PivotBAR] > highest[LookBack](high)[BarLookBack] THEN IF high[PivotBAR] = highest[BarLookBack](high) THEN MyResistance = BarIndex - PivotBAR ResistancePrice = high[PivotBAR]//high[BarIndex - MyResistance] ENDIF ENDIF DRAWSEGMENT(MyResistance,ResistancePrice,BarIndex,ResistancePrice) COLOURED(255,0,0,255) DRAWSEGMENT(MySupport,SupportPrice,BarIndex,SupportPrice) COLOURED(0,128,0,255) RETURN |
Share this
No information on this site is investment advice or a solicitation to buy or sell any financial instrument. Past performance is not indicative of future results. Trading may expose you to risk of loss greater than your deposits and is only suitable for experienced investors who have sufficient financial means to bear such risk.
ProRealTime ITF files and other attachments :
Find other exclusive trading pro-tools on ![]()
PRC is also on YouTube, subscribe to our channel for exclusive content and tutorials


This is one of best indicator to trade any time frame
Is this indicator as it is , useful in strategy automatic
Muy buen indicador
Hi Roberto
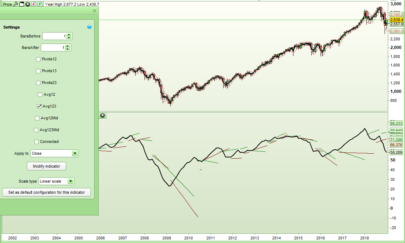
I am trying to use this indicator but once i import the itf file. the indicator gets imported but when i apply it to chart – it does not plot to the price chart rather it takes the space under the chart like Oscillators.
Could you please suggest what I am doing wrong.
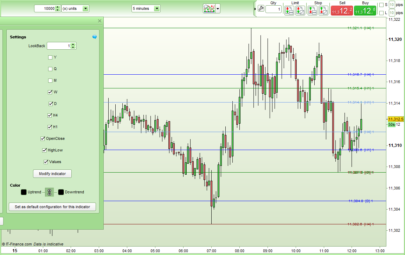
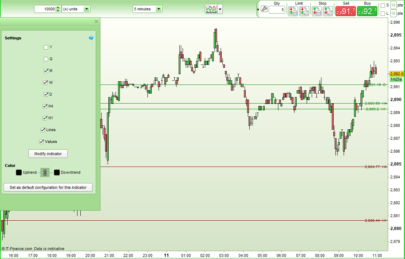
Click the wrench on the upper left corner of your chart, then select PRIICE on the left and click ADD INDICATOR and then again select the indicator of your choice.
thanks now its working
How would it be possible to call the Last Support Price and the Resistance Price from strategy?
Replace RETURN with RETURN SupportPrice,ResistancePrice.
When you CALL they will be returned in the same order you have written them next to RETURN, as you can easilysee from documentation and the many indicators and code snippets on these forums.
Great thank you
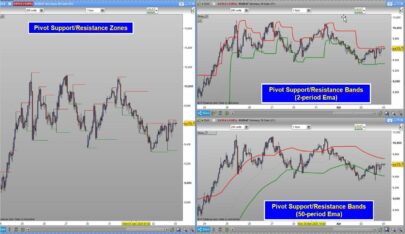
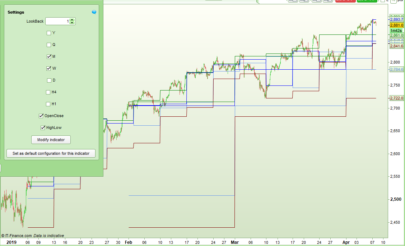
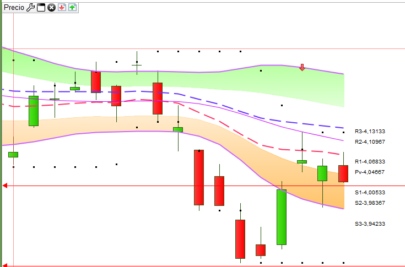
Thanks for this great indicator @Robertogozzi, I wondered if it was possible to make an exponential average band version? I tried to make 2 period EMA’s of the SupportPrice and ResistancePrice which almost works except for the bands lag behind the high resistance and low support areas. Cheers.
You can find it at https://www.prorealcode.com/topic/pivot-support-resistance-bands/.
I hope it’s what you wanted.
Yes, thanks, appreciated.
Hi @robertogozzi,
I really love this indicator. However, I’d like to tinker with it to fit my needs a bit better.
I am new to ProRealCode (and ProRealTime) in general, hence I’m having some issues getting it to where I want.
Please see this image:
https://imgur.com/a/Lwk2nvS
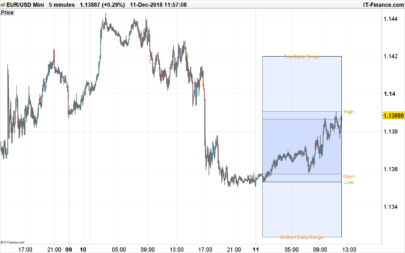
Would it be possible to alter the code so that it would draw rectangles as my image? Only on new highest high and lowest low. Potentially merging if two lines are “close” to each other. In the image attached, one example would be 1531 to 1527 (since 1531 and 1531 are so close to each other).
I love drawing out resistance/support levels like this, but it would of course save me lots of time if it could be done automatically. Would appreciate your input greatly and if you could point me in any direction.
In the best of worlds, I would later add so that it could draw boxes based on consolidation some patterns.
Kindest regards
Hi Roberto
I cannot thank you enough for writing this code. It could help me more than you know.
I have the same problem as another poster though in that I can’t add it to the chart. It comes up as an oscillator below the price chart. I don’t even appear to have a ‘wrench’ in the top left corner in order to sort this out.
Best wishes Ahimsa
With PRT v11, you have to click on “price” at the upper left side of the price chart.