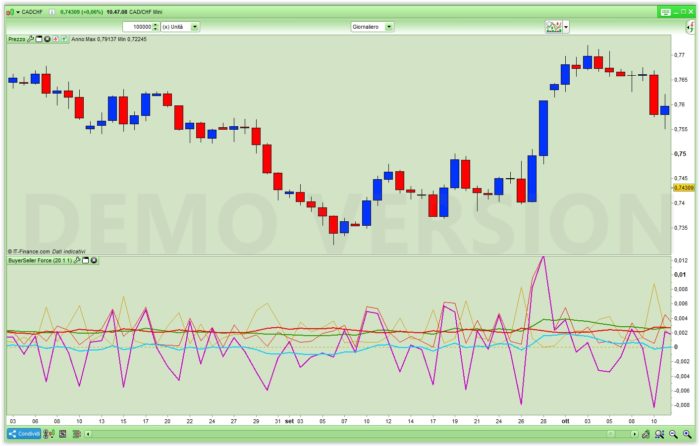
The FORCE of sellers can be measured by subtracting CLOSE from HIGH because they are pushing prices downwards, while that of buyers can be measured by subtracting CLOSE from LOW (or you can make it the other way round or use ABS()) as they push prices upwards.
I found this info very interesting, so I decided to make an indicator to represent graphically those forces.
It returns 6 data (plus 0, which is of not much use, though), which can be a bit confusing, but owing to the possibility of setting some returned data as INVISIBILE with its properties, I suggest that it be installed on a chart 4 times, selecting, for each one of them, different properties to visualize different data using colours of your choice:
1-select SELLAVG & BUYAVG to display the flow and crossings of those two averages
2-select DIFF & DIFFAVG to display the flow and crossings of the difference between the two group of traders
3-select BUYERS & BUYAVG to display the flow and crossings of the data referred only to Buyers
4-select SELLERS & SELLAVG to display the flow and crossings of the data referred only to Sellers
The settings are:
– Periods of the average
– Type of the average (0 – 6)
– whether ABS() should be used, or not, for the BUYERS’force (you can set it differently to see the difference)
I attach the code as both a .TXT and .ITF files, plus 4 pics.
|
1 2 3 4 5 6 7 8 9 10 11 12 13 14 15 16 17 |
DEFPARAM CalculateOnLastBars = 1000 //Periods = 20 //20 //AvgType = 1 //1 = ema //AbsFlag = 0 //1=Use ABS() 0=No ABS() Periods = max(2,min(999,Periods)) //2 - 999 AvgType = max(0,min(6,AvgType)) //0 - 6 AbsFlag = max(0,min(1,AbsFlag)) //0 - 1 BuyerForce = low - close IF AbsFlag THEN BuyerForce = abs(BuyerForce) ENDIF AvgBuy = Average[Periods,AvgType](BuyerForce) SellerForce = high - close AvgSell = Average[Periods,AvgType](SellerForce) Difference = BuyerForce - SellerForce AvgDiff = Average[Periods,AvgType](Difference) RETURN 0,BuyerForce AS "Buyers",SellerForce AS "Sellers",AvgBuy AS "BuyAvg",AvgSell AS "SellAvg",Difference AS "Diff", AvgDiff AS "DiffAvg" |
Share this
No information on this site is investment advice or a solicitation to buy or sell any financial instrument. Past performance is not indicative of future results. Trading may expose you to risk of loss greater than your deposits and is only suitable for experienced investors who have sufficient financial means to bear such risk.
ProRealTime ITF files and other attachments :
Find other exclusive trading pro-tools on ![]()
PRC is also on YouTube, subscribe to our channel for exclusive content and tutorials

HI,
Thanks a lot
Good job. 🙂