







Tested Levels Indicator
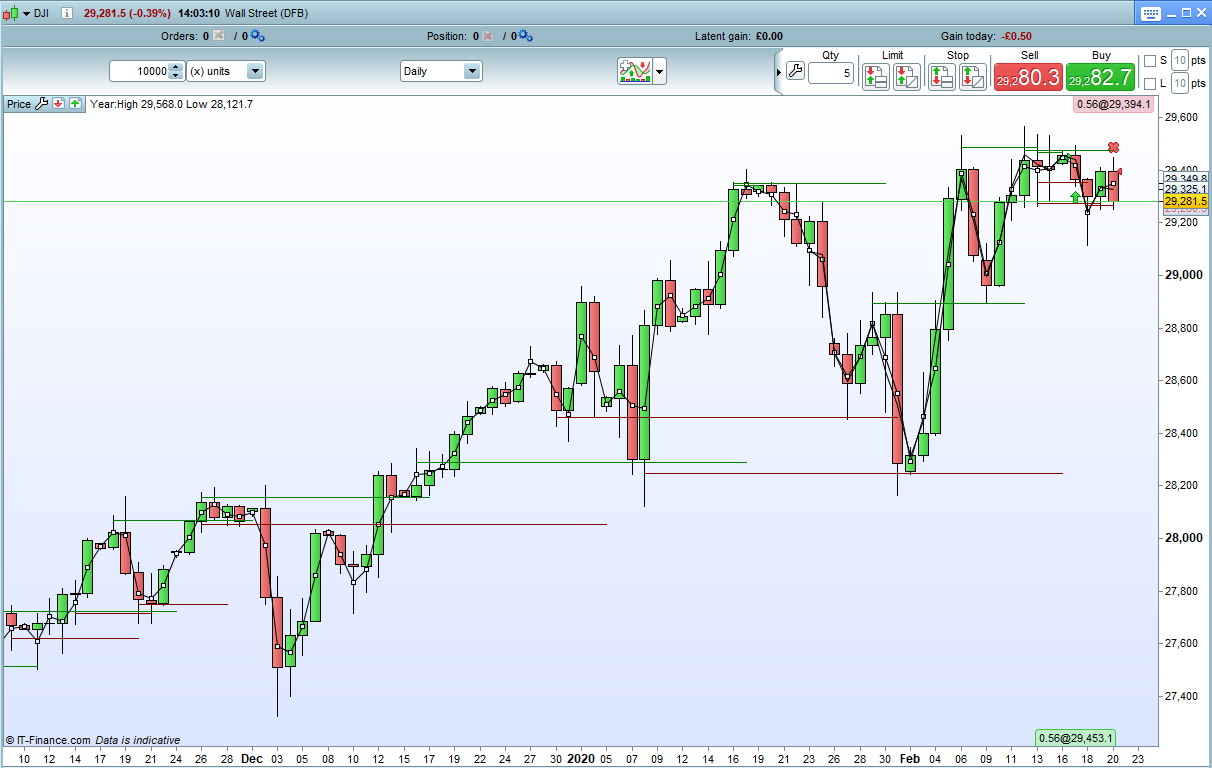
This indicator checks back over the last ‘p’ bars to see if the mid point of the current bars shadows have been tested by price and failed to breakout before.
Set ‘tests’ to the quantity of level tests you want to check for.
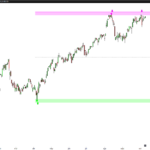
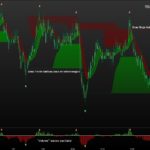
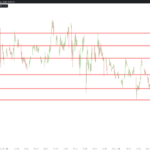
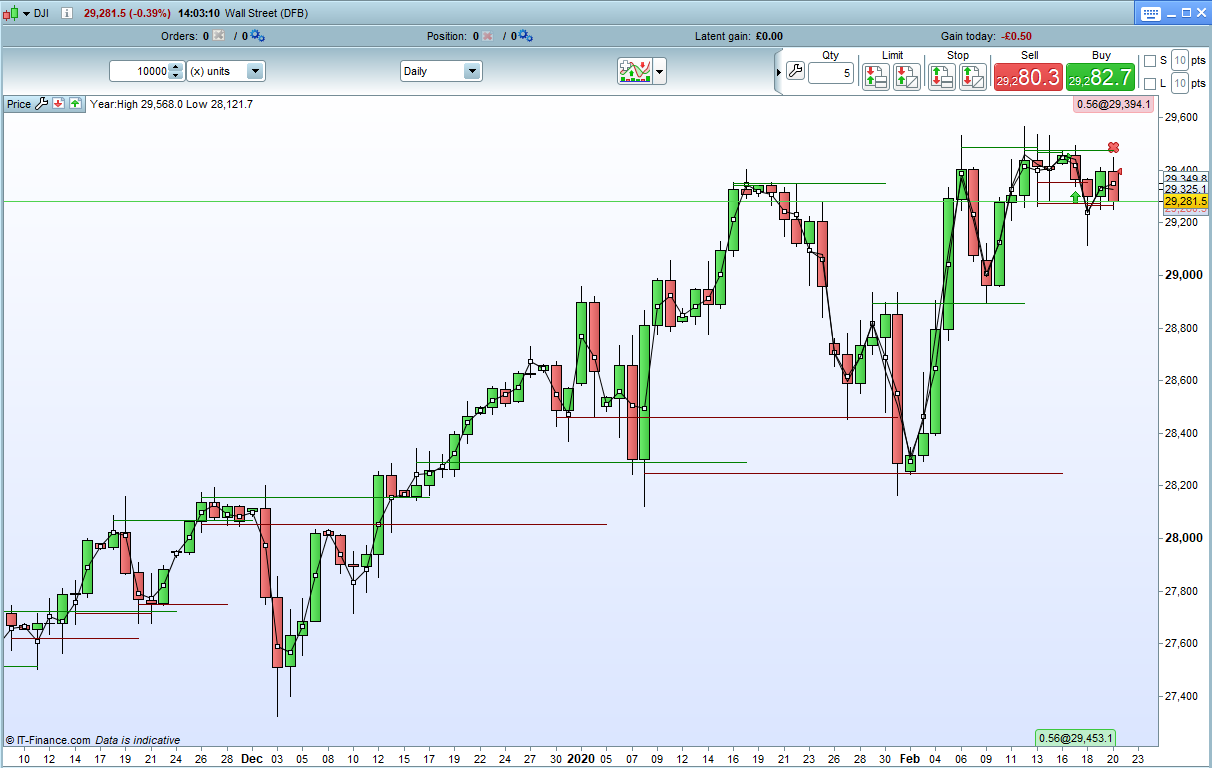
The indicator will draw a line from the first price test bar until a new set of price tests are detected. It draws green lines for upper shadow tests and red lines for lower shadow tests.
It can be slow to draw so I recommend setting the CALCULATEONLASTBARS to a sensible level.
I advise downloading and importing the ITF file to get full functionality.
//Tested Levels Indicator
//By Vonasi
//Date:20022020

defparam calculateonlastbars = 1000

//p = 200
//tests = 3

if barindex >=tests then

level = (high + max(open,close))/2

count = 1
draw = 0
for a = 1 to p
if close[a] > level then
break
endif
if high[a] >= level and max(close[a],open[a]) <= level then
count = count + 1
if count = tests then
startindex = barindex-a
draw = 1
break
endif
endif
next

if draw = 1 then
drawsegment(startindex,level,barindex,level) coloured(0,128,0)
lastlevel = level
else
drawsegment(barindex-1,lastlevel,barindex,lastlevel) coloured(0,128,0)
endif

level2 = (low + min(open,close))/2

count = 1
draw2 = 0
for a = 1 to p
if close[a] < level2 then
break
endif
if low[a] <= level2 and min(close[a],open[a]) >= level2 then
count = count + 1
if count = tests then
startindex2 = barindex-a
draw2 = 1
break
endif
endif
next

if draw2 = 1 then
drawsegment(startindex2,level2,barindex,level2) coloured(128,0,0)
lastlevel2 = level2
else
drawsegment(barindex-1,lastlevel2,barindex,lastlevel2) coloured(128,0,0)
endif
endif

return
Comments
You must be logged in to post a comment.

Re, C'est ok, j'ai trouvé mon erreur... Cependant sur quel base peut on calculer son CALCULATEONLASTBARS à un niveau raisonnable ? Merci à vous,
Bonjour à tous, Avant tout merci pour ce travail, cependant je suis bloqué quand je l'installe sur prt. On me demande de régler le p et le test mais je n'arrive pas à trouver à quel endroit, je dois inscrire ces variables. Dans l'attente de vous lire, Merci à tous

Hi Vonasi, I find this indicator very useful. May I request , if you can, to please modify and show close below the defined levels as a DOWN arrow and close above as an UP arrow , generate alert, and make this a screener as well? Regards!


Bonjour Vonasi, Bravo pour ton travail ! Est-il possible de créer un screener quand le prix repasse à la hausser la ligne de Support rouge ?

Hi , Helpful indicator ...
Hi Nicolas, How is it possible to use it in a higher timeframe plotted on a lower timeframe? when I do this, lines are plotted completely offset on the left to the candles.