Pivot point traded during the day?

Pivot point traded during the day?

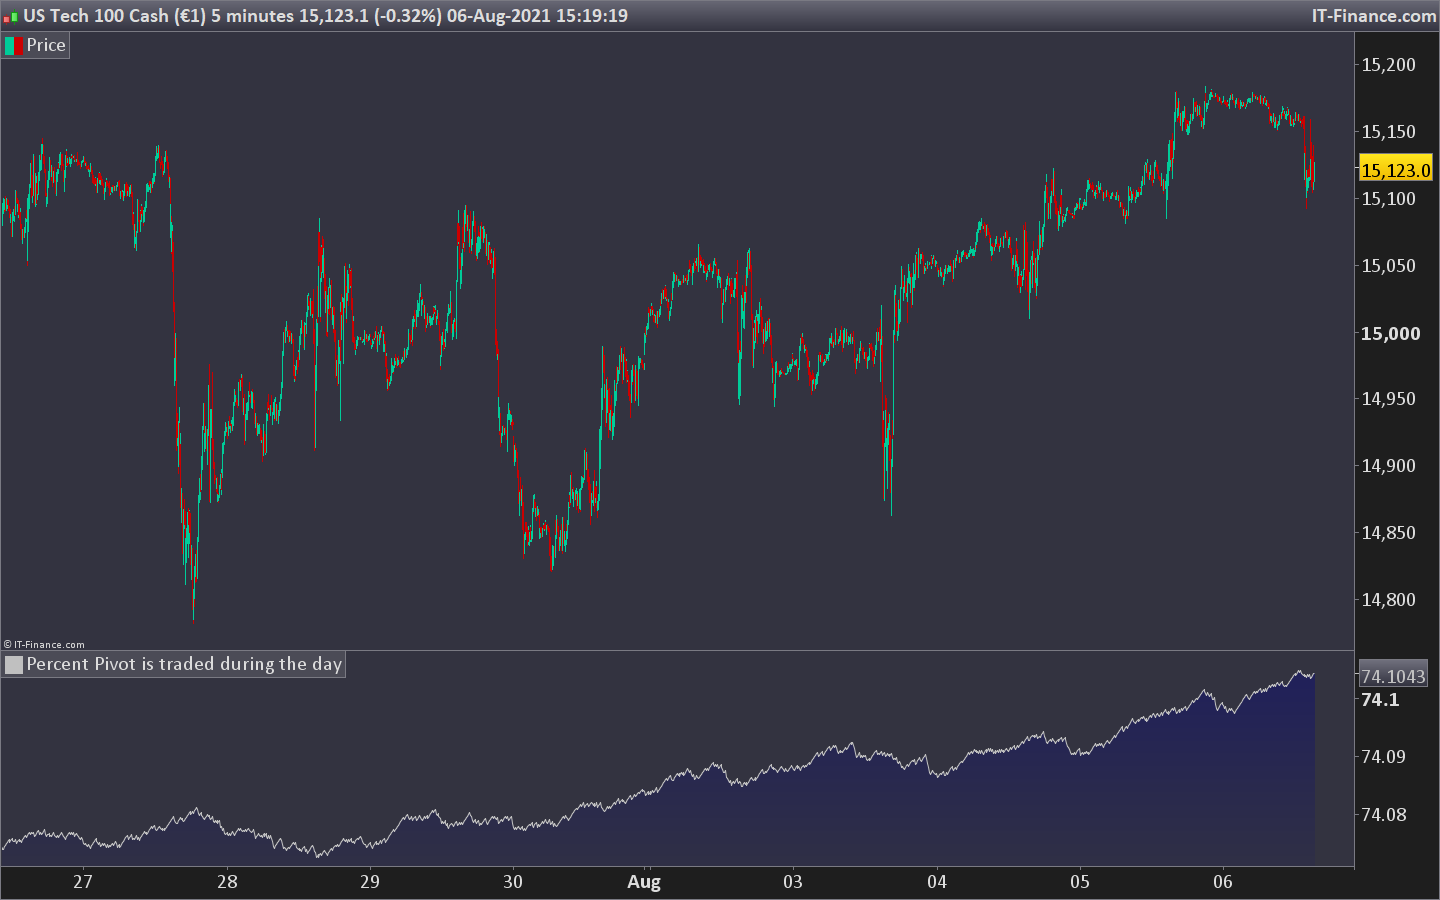
Indicator that checks and calculate how often the pivot point is traded during the day.

The indicator calculates the pivot point as (high+low+close)/3 of the previous bar and checks if it is within the range of high/low of the current bar.  If the pivot is between the high and low then the number of times trade is increased by 1.  If not traded the value remains the same.

The amount of time the pivot is traded is then diveded by the number of bars loaded into the chart and returned as the percentage indicator value.

Share this

Risk disclosure:

No information on this site is investment advice or a solicitation to buy or sell any financial instrument. Past performance is not indicative of future results. Trading may expose you to risk of loss greater than your deposits and is only suitable for experienced investors who have sufficient financial means to bear such risk.

ProRealTime ITF files and other attachments : How to import ITF files into ProRealTime platform?

PRC is also on YouTube, subscribe to our channel for exclusive content and tutorials

  1. cdc.andersson • 08/06/2021 #

    Hej! Jag försöker lära mig att koda PRT. Jag vill testa en strategi med RSI-värde, ATR-värde, SMAs och Heikin Ashi. Jag försöker förstå hur jag ska kunna få PRT att gå lång beroende på stängd grön eller stängd röd bar. Har du några tips?

  2. Swingforfortune • 08/06/2021 #

    Du kan väl jämföra om open > close (röd) eller open < close (grön)

avatar
Register or

Likes

avatar avatar avatar
Related users ' posts
francis59 Hello Ivan, thanks for this very nice and powerfull indicator. Could you have time to create...
Iván Hi We could find stocks with sweep on: //PRC_Sweep Institucional //version = 0 //28.0...
inverse Like the way you think Ivan ... :)
Nicolas
10 months ago
Maxime Baudin Well done Nicolas, creative!
Stenozar Hi Nicolas, please can you explain how to read/use this indicator? thanks!
YvesRobert Hi smp, how should I configure this indicator because everything is at zero -> High, Clos...
smp Hi, this is an end of day pivots indicator, so you need to find the end of day pivot info; t...
YvesRobert Thank you smp.
smp I also have an End Of Day (EOD) cash pivot indicator for use on cash markets; this indicator...
IV Mcm I don't speak English and the translation is not clear. Do you have a different turn of ...
IV Mcm stonk ?
avatar
Anonymous Thanks very much for sharing, look forward to testing this idea out.
Noobywan (My apologies for unformatted code, the formatting only works in forum or library posts not ...
Noobywan Hi FXTT, no problem for requests (as long as no one requests me singing), just usually it’s ...
JC_Bywan Bug fix at line 38, should be: if changebarre or (opentime[1]=start) then (same as in ...
Nicolas Oui le code est correct et il fonctionne, j'ai de bons résultats sur la liste NASDAQ par exe...
pincherman Bonjour :-) J'ai coller le script dans prorealtime pour jouer avec le supertrend et j'ai un...
Nicolas Vous l'avez sans doute collé au mauvais endroit, dans l'éditeur de code pour les stratégies,...
Bhanu Pratap Great Work Sir, Hats Off.
bolsatonimora2 Hi Roberto, It is possible to modify this indicator which it marks the supports and resist...
robertogozzi What do you mean by "very high volume"? What do you want to be printed exactly?
Bard Very interesting approach Vonasi! I'm getting a 404 error when trying to download though?
Vonasi I just tested and I was able to download with no error.
Psari Hi Vonasi, I am a newbie and was wondering whether you could possibly help me with this pro...
mscharstrom Hi @robertogozzi, I really love this indicator. However, I'd like to tinker with it to fit ...
Ahimsa Hi Roberto I cannot thank you enough for writing this code. It could help me more than you ...
Nicolas With PRT v11, you have to click on "price" at the upper left side of the price chart.
Juanjo Hola?. Exactamente cuál es su utilización?.
bolsatrilera Hola Juanjo, su principio esparecido a las bandas de Bollinguer.Las lineas de las bandas son...
Vonasi The indicator code can easily be adapted for use as a filter in strategies as well. For exam...
AVT Tested today in manual DAX trading (transcripted to MT and changed look into aka oszillator)...
Vonasi I think that short time frame charts will be too noisy for this indicator. One blue bar real...
Vonasi I forgot to mention in the description that Sunday pivot lines are ignored and Monday's pivo...
AVT Like that, simple and clear!
Vonasi Thanks AVT. I like simple - some people would say that I do simple very well! Sometimes you ...
Nicolas Please open a new forum topic, and respect the posting rules. Add a precise description of w...
FXTT ok will do, apologies, as I said I am new here. many thanks
Noobywan Version v2 including requested additions: https://www.prorealcode.com/prorealtime-indicators...
Trading_En_El_Ibex35 Para calcular el punto pivote y los niveles de soporte y resistencia para operar durante la ...
supertiti Hola mis disculpas, creia que tu eres Jose Antonio Madrigal ! gracias por las explicaci...
Trading_En_El_Ibex35 espero que las explicaciones te hayan sido de ayuda saludos
Paul Thanks for posting. I was currently searching how to improve day-trading based on support an...
Jessar Könntest du im Forum etwas öffnen und später darüber zu sprechen?
arahussein Hi All, I am new to trading and i find this indicator very logicail! Hence my (dumb?) quest...
juju333 Merci Nicolas, j'utilisais avec bonheur ce code dans la 10.3, il ne tourne plus dans la v11....
Nicolas Remplacer les lignes 11 et par 12 avec: yearlyHigh = Highest[max(1,BarIndex - lastYearBarI...
juju333 merci !!!

Top