







PP Fractals
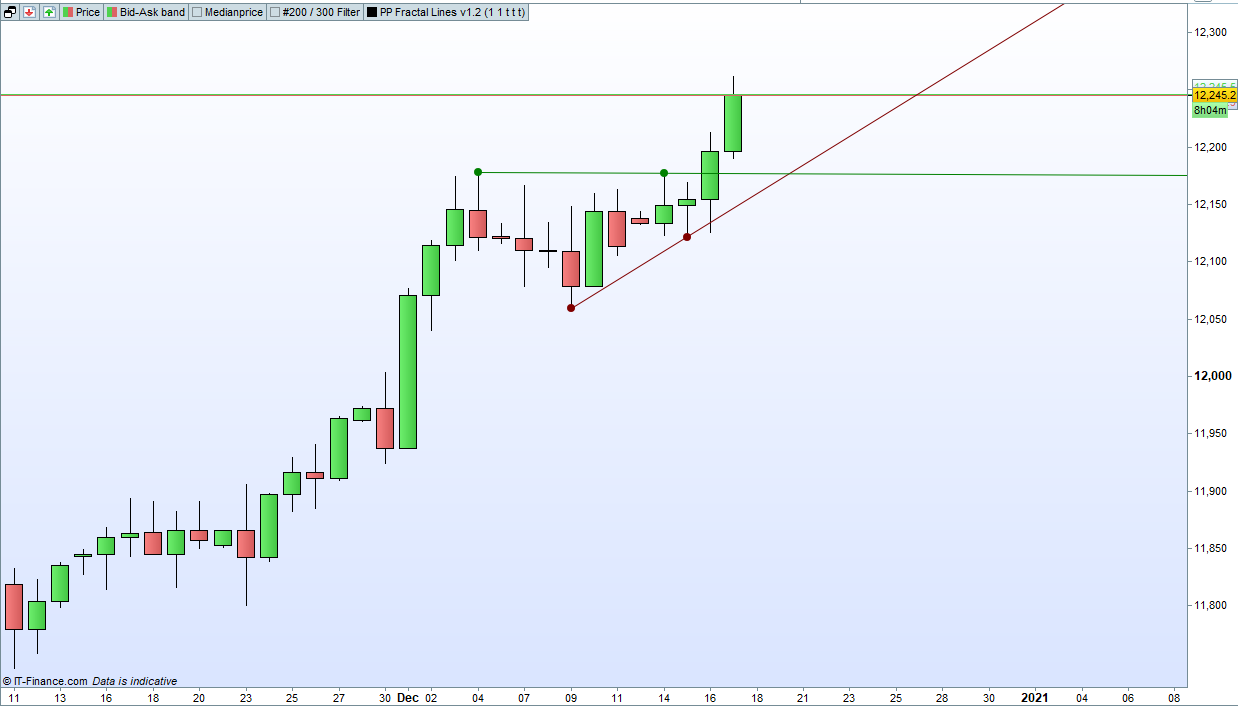
This indicator is called ‘PP Fractals’ as I coded it following a request from ParthaPersonal.
This indicator works on v11 onwards only.
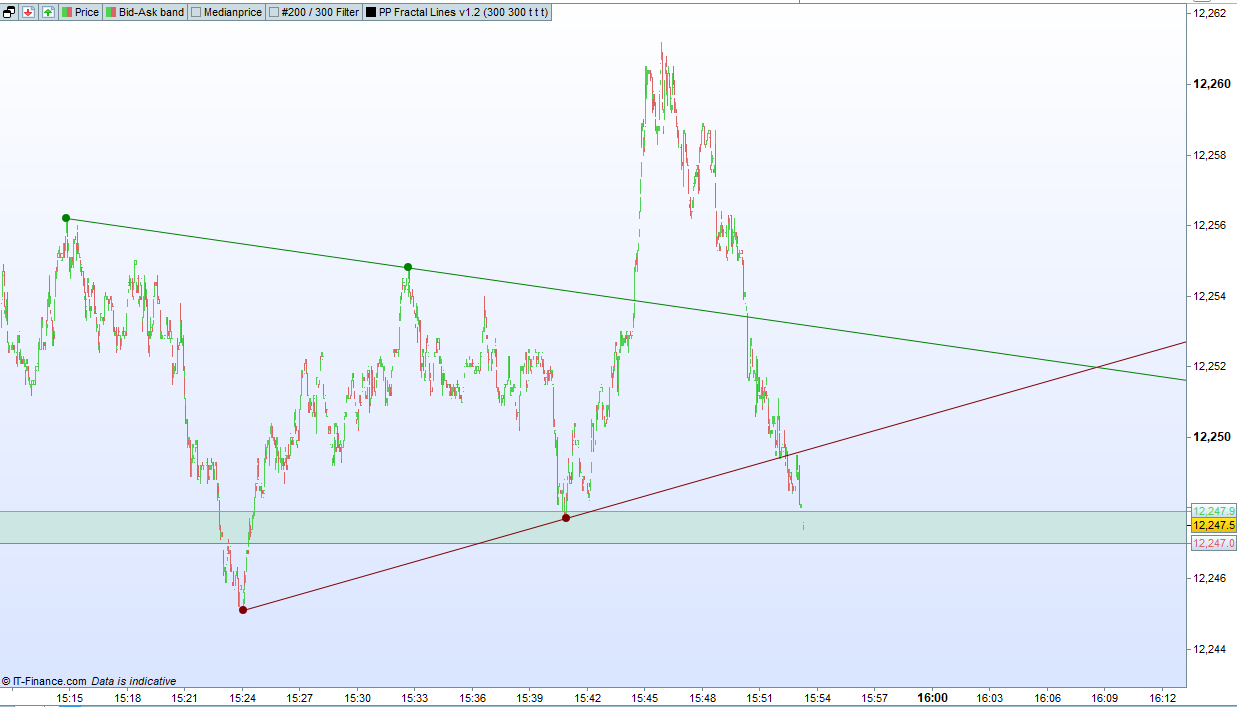
The indicator draws lines extended forward that connect the last two fractals – however the high fractal lines must always be sloping downwards and the low fractal lines always sloping upwards. New lines are only drawn if any new fractal creates a line that meets this sloping criteria with a previous fractal.
The type of fractal can be selected by adjusting the ‘BarsBefore’ and ‘BarsAfter’ settings. So for example settings of 2 and 1 would look for fractals where there are two lower highs before a bars high and one lower high after it. The opposite using higher lows for low fractals.
On a 1 second chart for example you could use settings of 300 and 300 which would look for fractals where there has not been a higher high for 5 minutes (of 1 second bars) either side of the high.
The drawing of the resistance and support lines can be turned on or off using the ‘Resistance’ and ‘Support’ tick boxes.
Points indicating the fractal highs and lows used are drawn and these can be turned off using the ‘Points’ tick box.
As always I recommend downloading the ITF file and importing it to get full functionality.
//PP Fractals v1.2
//PRT v11
//By Vonasi
//Date: 20201217

defparam drawonlastbaronly = true
//Settings
BarsBefore = 1
BarsAfter = 1
Support = 1
Resistance = 1
Points = 1

//Make sure all settings are valid ones
BarsBefore = max(BarsBefore,1)
BarsAfter = max(BarsAfter,1)
StartBack = max(0,startback)

if barindex >= barsbefore + barsafter then

//Look for a low fractal
BarLookBack  = BarsAfter + 1
if low[BarsAfter] < lowest[BarsBefore](low)[BarLookBack] THEN
if low[BarsAfter] = lowest[BarLookBack](low) THEN
a = a + 1
$supportbar[a] = barindex[barsafter]
$supportvalue[a] = low[barsafter]
endif
endif

//Look for a high fractal
if high[BarsAfter] > highest[BarsBefore](high)[BarLookBack] THEN
if high[BarsAfter] = highest[BarLookBack](high) THEN
b = b + 1
$resistancebar[b] = barindex[barsafter]
$resistancevalue[b] = high[barsafter]
endif
endif

if islastbarupdate then
//support line
if a >= 2 then
if support then
flag = 0
zz = 0
for z = a-zz downto 1
for xx = 1 to a
if z-xx < 1 then
break
endif
if $supportvalue[z] > $supportvalue[z-xx] then
drawray($supportbar[z-xx],$supportvalue[z-xx],$supportbar[z],$supportvalue[z]) coloured(128,0,0)
if points then
drawpoint($supportbar[z],$supportvalue[z],2) coloured(128,0,0)
drawpoint($supportbar[z-xx],$supportvalue[z-xx],2) coloured(128,0,0)
endif
flag = 1
break
endif
zz = zz + 1
next
if flag = 1 then
break
endif
zz = 0
next
endif
endif

//resistance line
if b >= 2 then
if resistance then
flag = 0
zz = 0
for z = b-zz downto 1
for xx = 1 to b
if z-xx < 1 then
break
endif
if $resistancevalue[z] < $resistancevalue[z-xx] then
drawray($resistancebar[z-xx],$resistancevalue[z-xx],$resistancebar[z],$resistancevalue[z]) coloured(0,128,0)
if points then
drawpoint($resistancebar[z],$resistancevalue[z],2) coloured(0,128,0)
drawpoint($resistancebar[z-xx],$resistancevalue[z-xx],2) coloured(0,128,0)
endif
flag = 1
break
endif
zz = zz + 1
next
if flag = 1 then
break
endif
zz = 0
next
endif
endif

endif
endif


return
Comments
You must be logged in to post a comment.


It is not possible to detect when a drawn ray line has been crossed. It would require different code that calculates the slope of the lines by using the x and y values between the fractals and then calculates this projected forward at each new bar. This is not always accurate though as any missing bars mess up the calculation.


Hi Vonasi, I tried to embed your PP Fractals code in a Strategy and it seems to be a good filter. However, I've a problem with the limitation of 1,000,000 values in the Array table. Can you please look at the issue here https://www.prorealcode.com/topic/pp-fractals-error-message/#post-189001. Thanks a million!

Hello. Thanks for the great contribution of the indicator. At the moment, I have modified it to calculate the cut-off point on the trend line, so that I have a value. I'm trying to get a screener out but I can't get it to work. Could you help me? Thanks