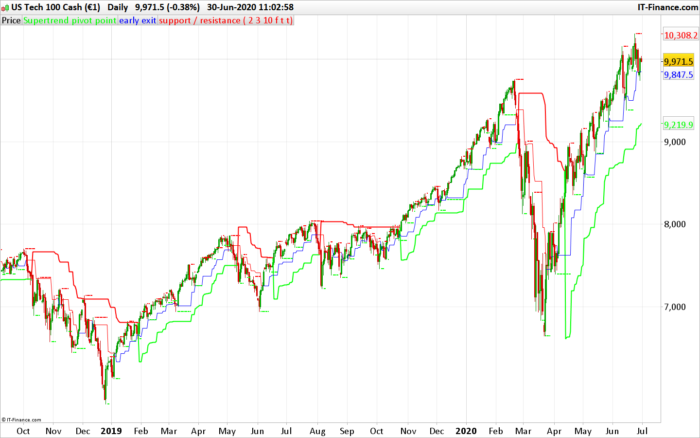
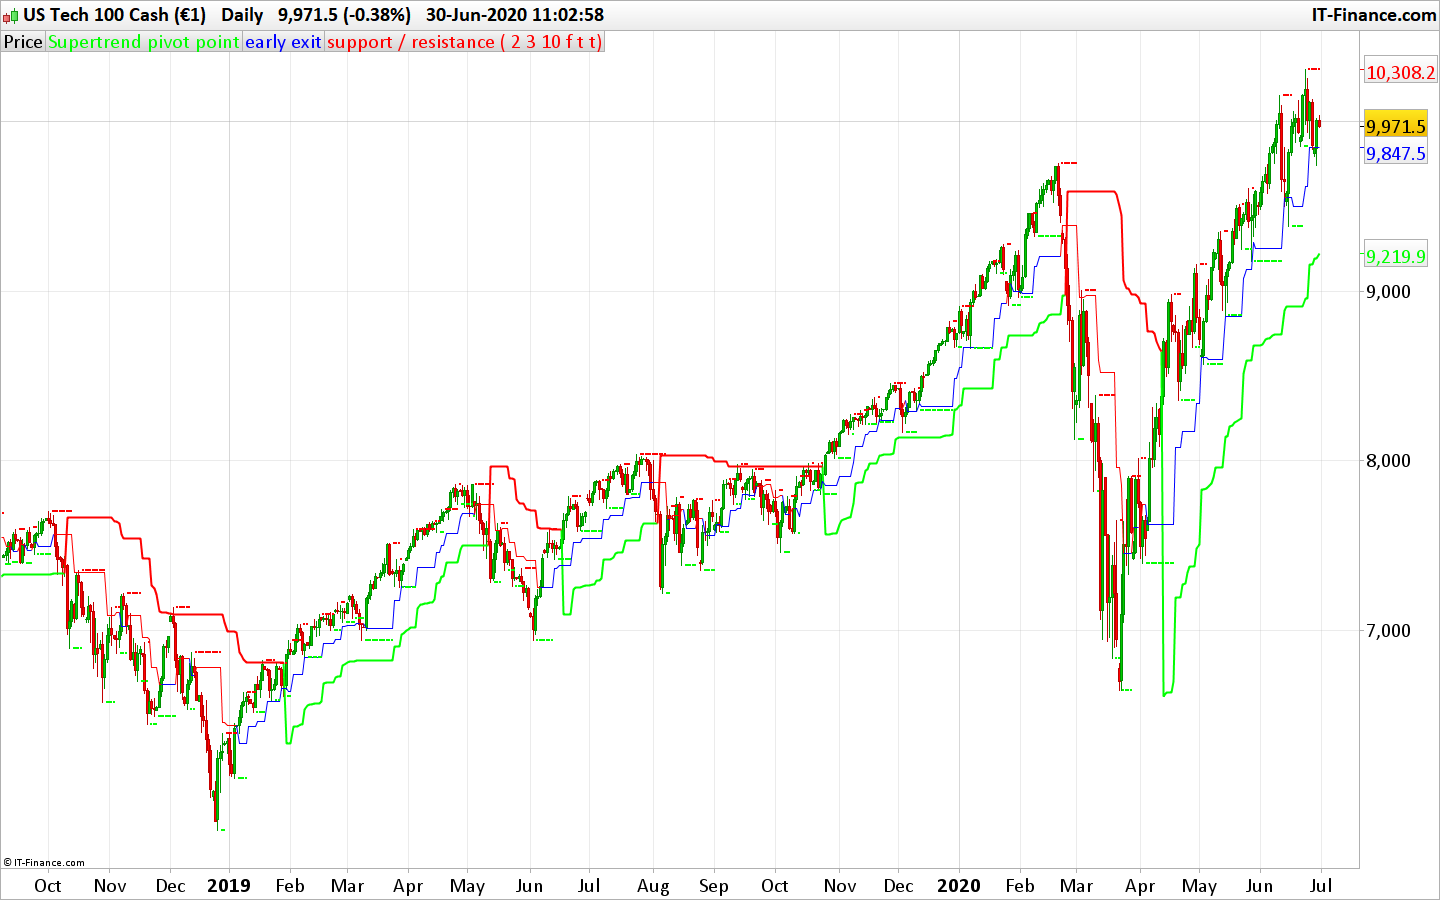
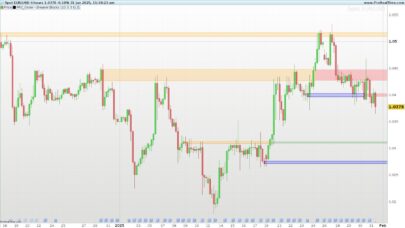
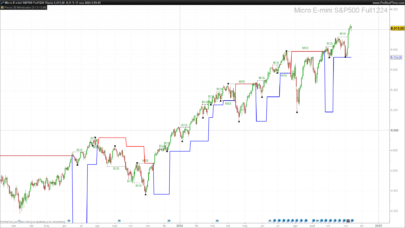
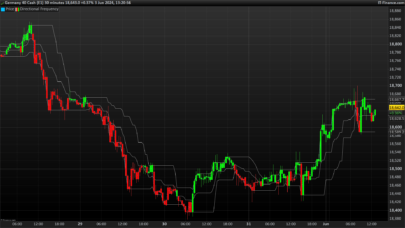
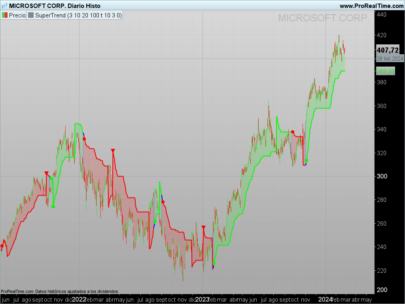
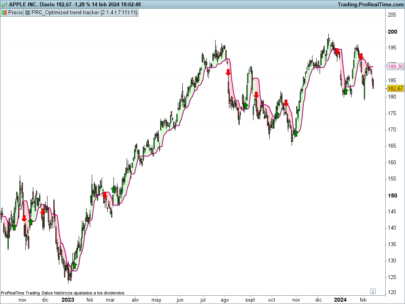
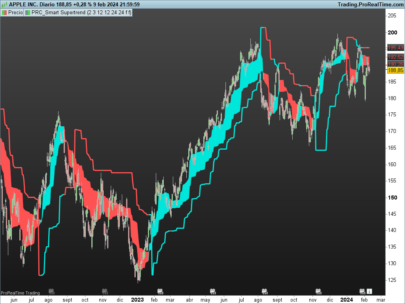
The Pivot point Supertrend uses the high/low pivot points (same as fractals) to calculate the Supertrend levels and therefore create a trend following / trailing stoploss indicator. This code was converted from pinescript version following a request in the indicator forum section (author: Lonesome TheBlue, all credits to him).
There are many types of SuperTrend around. Recently I thought about a Supertrend based on Pivot Points then I wrote “Pivot Point SuperTrend” script. It looks it has better performance on keeping you in the trend more.
The idea is behind this script is finding pivot point , calculating average of them and like in supertrend creating higher/lower bands by ATR. As you can see in the algorithm the script gives weigth to past pivot points , this is done for smoothing it a bit.
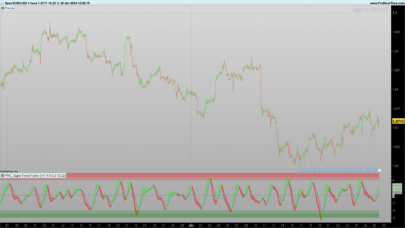
As an option the script can show main center line and I realized that when you are in a position, this line can be used as early exit points. (maybe half of the position size).
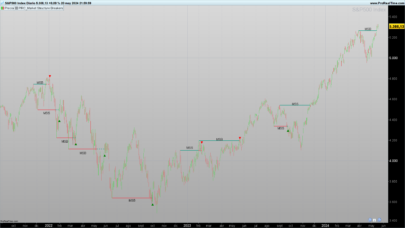
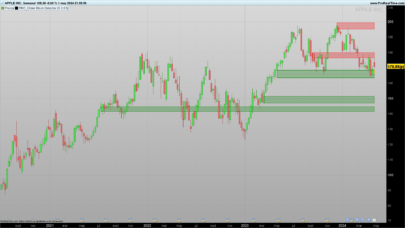
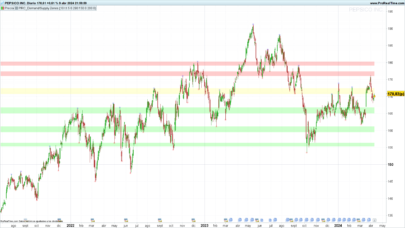
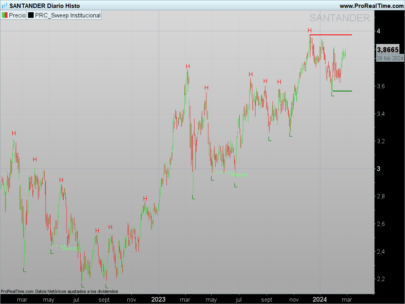
While using Pivot Points , I added support resistance lines by using Pivot Point , as an option the script can show S/R lines.
And also it can show Pivot Points.
(author description).
|
1 2 3 4 5 6 7 8 9 10 11 12 13 14 15 16 17 18 19 20 21 22 23 24 25 26 27 28 29 30 31 32 33 34 35 36 37 38 39 40 41 42 43 44 45 46 47 48 49 50 51 52 53 54 55 56 57 58 59 60 61 62 63 64 65 66 67 68 69 70 71 72 73 74 75 76 77 78 79 80 81 82 83 84 85 86 87 88 89 90 91 92 93 94 95 96 |
//PRC_Pivot Point Supertrend | indicator //30.06.2020 //Nicolas @ www.prorealcode.com //Sharing ProRealTime knowledge //converted from pinescript // -- settings prd = 2 //Pivot Point Period Factor = 3 //ATR Factor Pd = 10 //ATR Period showpivot = 0 // Show Pivot Points (1 = true ; 0 =false) showcl = 0 //Show PP Center Line (1 = true ; 0 =false) showsr = 0 //Show Support/Resistance (1 = true ; 0 =false) // --- end of settings atr = averagetruerange[14] if high[prd] >= highest[(prd)*2+1](high) then ph = high[prd] if showpivot then drawtext("H",barindex[prd],ph+atr/2,dialog,standard,20) coloured(255,0,0) endif lastpp = ph endif if low[prd] <= lowest[(prd)*2+1](low) then pl = low[prd] if showpivot then drawtext("L",barindex[prd],pl-atr/2,dialog,standard,20) coloured(0,255,0) endif lastpp = pl endif if lastpp<>lastpp[1] then if center=0 then center = lastpp else center = (center * 2 + lastpp) / 3 endif endif Up = center - (Factor * averagetruerange[Pd]) Dn = center + (Factor * averagetruerange[Pd]) Trend = 0 if close[1] > TUp[1] then TuP = max(Up, TUp[1]) else TuP= Up endif if close[1] < TDown[1] then TDown= min(Dn, TDown[1]) else TDown= Dn endif if close > TDown[1] then trend = 1 elsif close < TUp[1] then trend = -1 else trend = Trend[1] endif once trend=1 if Trend = 1 then trailingsl = TUp r=0 g=255 else trailingsl = TDown r=255 g=0 endif if showcl then alpha=255 if center<medianprice then clr=0 clb=255 else clr=255 clb=0 endif endif sr = undefined if showsr then sr = lastpp if lastpp=ph then srr=255 srg=0 else srr=0 srg=255 endif endif return trailingsl coloured(r,g,0) style(line,2) as "Supertrend pivot point", center coloured(clr,0,clb,alpha) as "early exit", sr coloured(srr,srg,0) style(point,2) as "support / resistance" |
Share this
No information on this site is investment advice or a solicitation to buy or sell any financial instrument. Past performance is not indicative of future results. Trading may expose you to risk of loss greater than your deposits and is only suitable for experienced investors who have sufficient financial means to bear such risk.
ProRealTime ITF files and other attachments :
Find other exclusive trading pro-tools on ![]()
PRC is also on YouTube, subscribe to our channel for exclusive content and tutorials


Bonjour nicolas, y a t il un moyen de te contacter pour discuter avec toi ? Je te remercie
Le forum est fait pour ça, posez y vos questions. Pour l’assistance privé merci d’utiliser le formulaire de cette page: https://www.prorealcode.com/trading-programming-services/
Bonjour Nicolas,
y a t’ il une manipulation à faire pour afficher la courbe early exit? J’ai passé toute l’après-midi dessus je n’ai pas trouvé c’est dire mon niveau =). Tout se joue dans la ligne 96 c’est correct?
Cordialement
Anthony
Ces courbes sont déjà affichées sur le graphique, voire l’instruction RETURN en fin de code.
Oui c’est pour cela que je ne comprends pas trop pourquoi elles ne s’affichent pas j’ai bien la courbe supertrend et le support/resistance mais pas le early exit bizarre….merci en tout cas je vais continuer de chercher =). Bonne journée
Le paramètre showcl doit être en true (égal à 1 )
Ah oui en effet c’est magique!j’étais resté bloqué sur la ligne 96^^. Merci beaucoup nicolas pour votre aide
Merci Nicolas, c’est superb!
Merci Nicolas pur ce travail. Comment écrire un screener qui nous ressortent d’une part les valeurs qui croise à la hausse la ligne du supertrend “principal” de ce code ? et la version à la baisse ? Merci
Avec l’assistant de création pour les screeners c’est possible, le code est compatible.
Merci Nicolas, avec l’assistant cela donne le code ci dessous. Est-ce correct ? De plus est-il possible de placer une alerte quand une valeur sort dans le screener pour éviter de passer son temps a attendre devant ? Car lors de mes essais je n’ai rien qui est ressorti.
Voici le code :
indicator1, ignored, ignored = CALL “PRC_Pivot Point Supertrend”[2, 3, 10, 0, 1, 0](close)
c1 = (close CROSSES OVER indicator1)
SCREENER[c1] ((close/DClose(1)-1)*100 AS “% Veille”)
Désolé j’ai essayé avec ADD PRT CODE mais cela n’a pas fonctionné.
Oui le code est correct et il fonctionne, j’ai de bons résultats sur la liste NASDAQ par exemple.
Bonjour 🙂
J’ai coller le script dans prorealtime pour jouer avec le supertrend et j’ai une erreur de syntaxe ligne 20 et 23.
L’erreur indique :
Une des expressions suivantes serait plus appropriée que “DRAWTEXT”:ENDIF
Merci pour votre aide 🙂
Vous l’avez sans doute collé au mauvais endroit, dans l’éditeur de code pour les stratégies, alors qu’il s’agit d’un indicateur. L’idéal étant de télécharger le fichier itf et de l’importer via le bouton approprié, le code se placera alors automatiquement dans la liste des indicateurs.