UT BOT ALERTS

UT BOT ALERTS

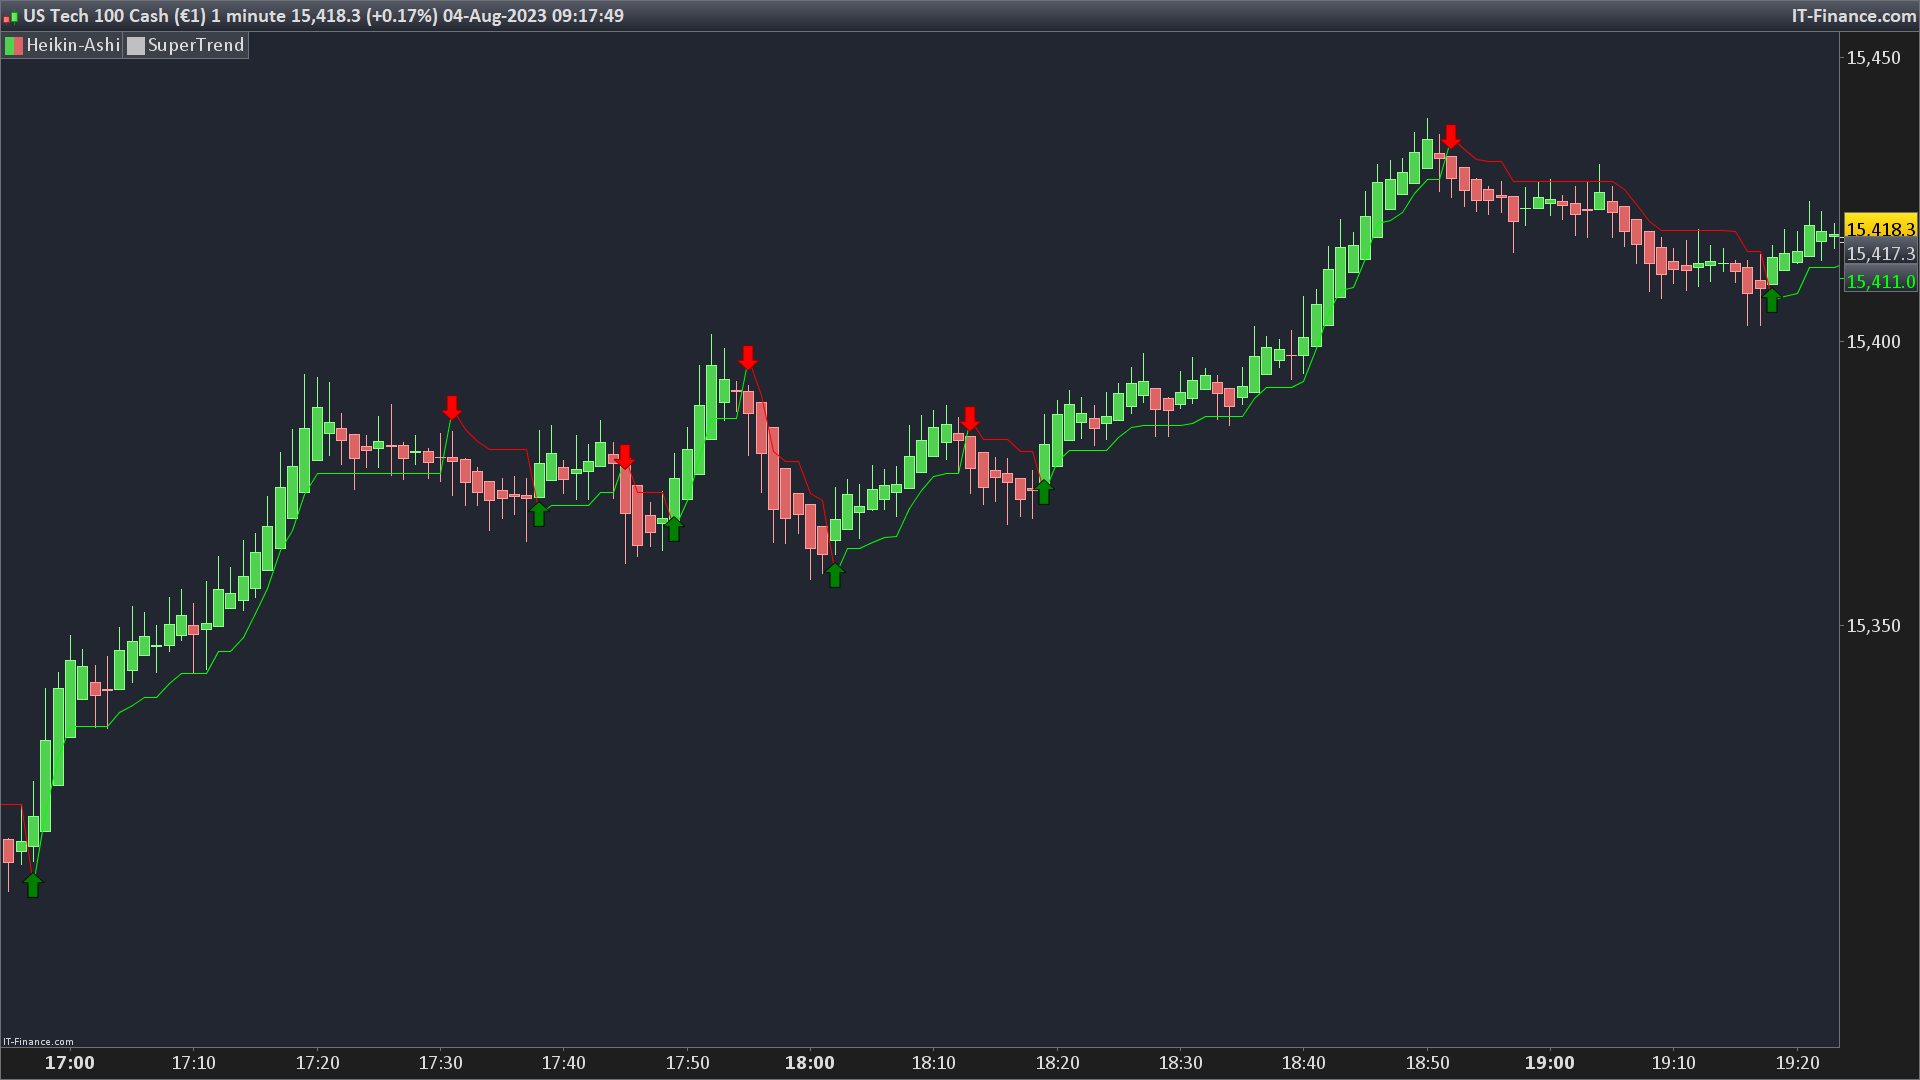
This code gives signals upon a “SuperTrend.” calculated with HeikinAshi candlesticks. It’s a way of showing where the general direction of a market (like stocks or currencies) is heading.

Here’s how it works:

  1. **Setting up the Basics**: At the start, there are some basic settings – a sensitivity key and a period. The sensitivity key makes the tool more or less reactive. The period refers to how many past data points we’re looking at to help make decisions.
  2. **True Average Range**: The code then calculates something called the “average true range.” Think of this as a way to measure how much prices are moving around.
  3. **Setting Upper and Lower Boundaries**: Using the average true range, it sets two boundaries: an upper one and a lower one. These boundaries help us determine if the market is going upwards or downwards.
  4. **Trend Determination**: If the current price goes above the upper boundary from the previous time, we think the trend is upwards. If it goes below the lower boundary, the trend is downwards.
  5. **Flags**: These are just little markers to help us remember if the trend just changed direction. For example, if it was going upwards and suddenly changes downwards, we set a flag.
  6. **Adjusting Boundaries**: If the market is moving upwards and the lower boundary drops, we stick with the previous boundary. Similarly, if the market is moving downwards and the upper boundary rises, we stick with the previous boundary. But, if a trend change was flagged, we reset our boundaries.
  7. **Choosing SuperTrend Value**: Depending on the trend (upwards or downwards), our SuperTrend value will equal one of the boundaries.
  8. **Color Coding**: If the SuperTrend value is rising, it will be colored green. If it’s dropping, it will be colored red.
  9. **Drawing Arrows**: If the price crosses over the SuperTrend value going up, a green arrow is drawn. If it crosses going down, a red arrow is drawn. These arrows give a visual cue about where the market is heading.
  10. **Final Result**: The code finally gives out the SuperTrend value, color-coded based on its direction, to visually indicate where the market might be heading.

So, in essence, this code helps traders see, at a glance, whether a market is trending upwards or downwards and gives visual cues when that trend might be changing.


Share this

Risk disclosure:

No information on this site is investment advice or a solicitation to buy or sell any financial instrument. Past performance is not indicative of future results. Trading may expose you to risk of loss greater than your deposits and is only suitable for experienced investors who have sufficient financial means to bear such risk.

ProRealTime ITF files and other attachments : How to import ITF files into ProRealTime platform?

PRC is also on YouTube, subscribe to our channel for exclusive content and tutorials

  1. atlante • 256 days ago #

    hi nicolas you are the best

  2. atlante • 256 days ago #

    the big secrets we have in the little details

  3. kvacksa87 • 255 days ago #

    Går det att göra något automatiskt script till signalerna ?

    • Nicolas • 253 days ago #

      Simple strategy with this indicator is available here: https://www.prorealcode.com/topic/ut-bot-alerts-2/#post-218578

  4. FXtonio • 227 days ago #

    Nicolas…. MERCI 1 millions de fois, cet indicateur gagne dans 75% des cas en scalping m1 …

  5. davy42 • 123 days ago #

    bonjour, à quel moment apparait le fleche, à l’ouverture ou la fermeture de la bougie?
    merci

avatar
Register or

Likes

avatar avatar avatar avatar avatar avatar avatar avatar avatar avatar avatar avatar avatar avatar
Related users ' posts
Doddge Hola Iván, ¿sería posible crear un screener que indique cuándo las velas coloreadas del indi...
RTR Ivan thank you for the pro-screener. I a trying to understand how to write the signals from ...
Iván Hi, Lines 62 and 63. These lines define buy and sell conditions.
Iván
2 months ago
Iván I personally like it in daily timeframe
oliTR Many thanks Ivan, I copy/paste your code to try it but could only get a constant stable unif...
Iván Hi, I've copied the code above and it works... what asset are you trying? $indices array ...
Iván
3 months ago
Madrosat Hello Ivan You have interesting topics on indicators , smart supertrend, optimised trend t...
Iván Hi! thanks. All of these codes are translations requested in the forum. I've on mind to back...
Raspete01 Buenos días Iván, estoy intentando llevar el código eliminando los colores y pasando un Back...
gidien
3 months ago
Cram13 Bonjour, qu'elles sont les valeurs des variables ? Avec mes remerciements Marc
gidien This indicator will not return any value. You can change the last line to : return ao...
gidien SMA1 = MovingAverage Length applied to the source candles (high , low, op...
Bateson
5 months ago
sfl Removing the short side will help, I would like to know from the author where are the condit...
WE ARE SOCIETY DEFPARAM cumulateOrders = False rem CAC40 (france40) en 10 secondes rem à la ligne ci-dess...
David Daget Bonjour. A noter que cette stratégie fonctionne aussi sur le ftse. Ce qui n'est pas surprena...
Nicolas
9 months ago
Anthony2A Bjr, j ai des erreurs sur la ligne 69, 74, 78 et 80. sur drawcandle drawtext et endif. si ...
Lucas0000 Hello, Congratulations on this programming, it seems incredible to me, I am new to this but ...
plbourse Hello, I am trying to use this singal (in fact I have converted it to an indicateur giving B...
JS
10 months ago
BriceE Bonjour Nicolas, Je suis a la recherche d'indicateurs pour me donner la meilleure indicatio...
FXtonio @RICOU en 1 minutes avec un filtre de tendance ZLSMA 200 et eventuellement un rsi 7 , 69% de...
JC_Bywan For people interested in the screener: https://www.prorealcode.com/topic/screener-buy-sell-m...
octum Gracias NJicolas. Las lineas 35 y 36 dan fallo. (¿Es adrede para iniciados?) Puedes co...
Nicolas Je ne rencontre pas ce problème avec le NASDAQ par exemple, ce serait plus simple d'ouvrir u...
YvesRobert Bonjour Nicolas, en effet ca marche, je me suis trompé, j'ai bien tout le tracé. C'est parce...
oliTR Bonjour, les conditions longCond et shortCond ne contiennent-elles pas une condition qui s'a...
AndPar Buongiorno Nicolas, vorrei provare questo indicatore, ma quando lo inserisco in PRT mi vengo...
Nicolas Basta aggiungerlo al prezzo https://www.prorealcode.com/blog/video-tutorials/how-to-add-an-i...
Aragorna hello Nicolas, this indicator works with the last Beta version of PRT? Ive seen tha many in...
zilliq Thanks @Nicolas. I tried to use it as Trend in a proorder system, but don't know why, it doe...
Suzu Yuk He is right. MT and mavgMT are not defined and causing errors.....
venugopal Hi Nicolas, Thanks for this code. Is it possible to build a screener using this indicator?. ...
Nicolas It has been done in that topic. Enjoy.
Abouadam2 EFFICACE
IV Mcm Good job !
Manu L. Bonjour Nicolas, j'ai créé un screener avec l'aide à la prog en TF weekly mais je voudrai...
wtangsiri C'est exactement le même signal que donne le croisement et le décroisement de deux EMA (7 et...
PHAN100 bonjour, j'ai un bug sur le programme recopié prorealtime me dit qu'il y a un problème à ...
Nicolas Please open a topic in ProScreener forum with your query, I'll reply you there. Thank you.
manafull Thanks Nicolas, I post my question, along with the codes I am trying to convert from your in...
Nicolas I replied to your post here: https://www.prorealcode.com/topic/screener-for-rsi-and-linear-r...
IV Mcm Vous devez faire un clic droit sur le prix > propriété > ajouter indicateur Si vous...
punch1 Fonctionne pas chez moi il s'affiche rien pourtant j'ai bien fait le clic droit sur le prix ...
punch1 Je peux te faire un screen d'ecran si tu as un email :)
Fabian Hi Thomas, thanks for your explanations. Which indicator do you use in the screenshot ...
Thomas Thats On Balance Volume and Bollinger or SMA or what you want. It shows me the volume flow. ...
bertrandpinoy @MAKSIDE I would be grateful if you send me your version. have a nice day

Top