Order Blocks Volume indicator

Order Blocks Volume indicator

Introduction

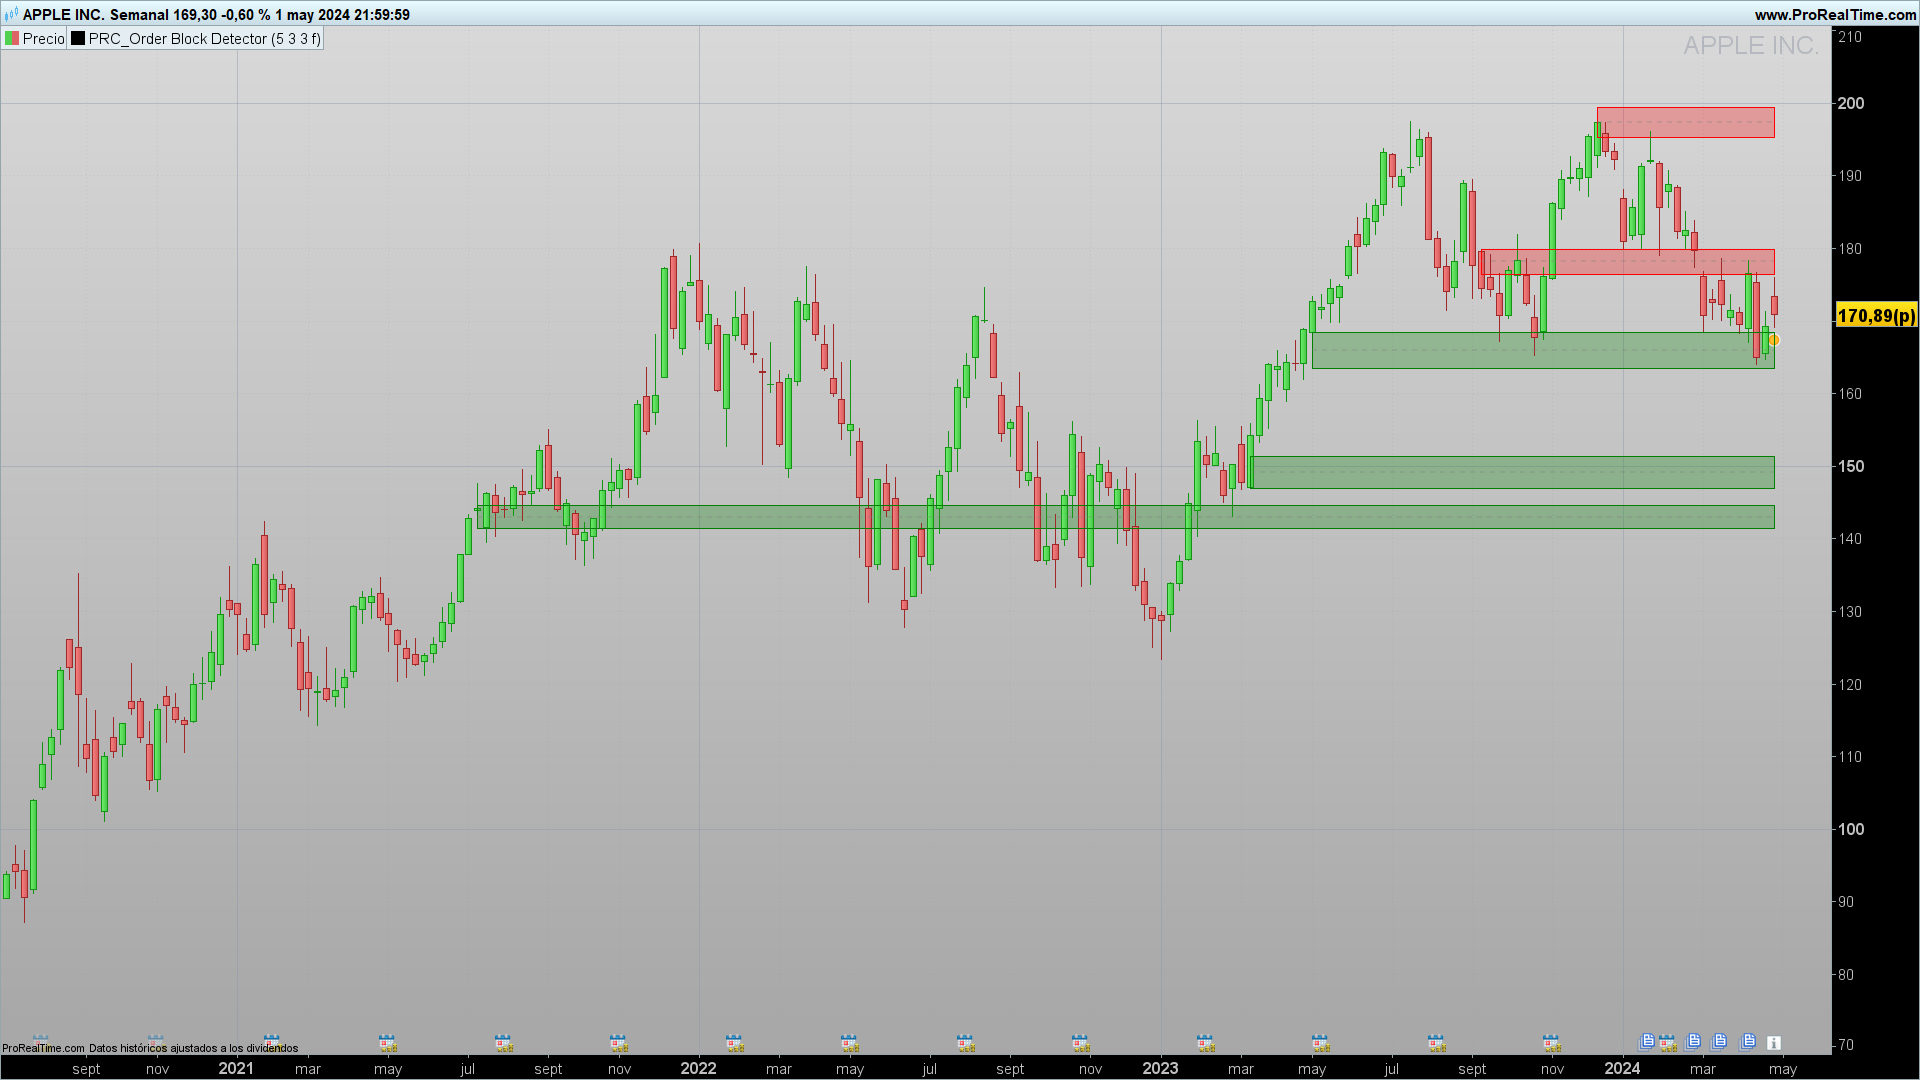
Order Blocks are critical concepts in technical analysis that help traders identify key areas where major market players have conducted significant buying or selling activities. These order blocks represent price levels at which there has been significant consolidation by institutional operators before a substantial price change. Identifying these can be crucial for determining efficient entry and exit points.

Theory of Order Blocks

An Order Block is essentially an accumulation of buy or sell orders that occur within a compact price range and can signal future price direction. These blocks are primarily categorized into two types:

  • Bullish Order Block: Forms after a downward movement, indicating an area where prices may be undervalued and where buyers might start to dominate.
  • Bearish Order Block: Develops after an upward movement and suggests an area where prices might be overvalued, attracting sellers.

The formation of these blocks indicates a pause before the market makes a significant move, making them strategic points for trading operations. There are several methodologies to calculate Order Blocks:

  • Volume-based pivots: Identify blocks where there is a significant increase in volume, suggesting an accumulation of orders.
  • Price-based pivots: Use price extremes to identify zones where the price has reacted strongly, suggesting a possible order accumulation.
  • Combination of volume and price: Analyzes both changes in volume and price for a more robust signal.

In the provided code, a volume-based pivot approach is used, where a peak in volume coinciding with a price direction change indicates the formation of an Order Block.

Indicator Configuration

The Order Block Detector indicator uses several settings to identify and visualize these important market levels:

  • length: Defines the number of bars to consider to identify a volume peak or trough, essential for determining an “Order Block”.
  • bullextlast and bearextlast: Set the number of bullish or bearish blocks to display, respectively.
  • mitigation: Decides whether the block is evaluated by the closing price or by the wick’s extreme, affecting the accuracy of the detected block.

Code of the Indicator

The code for ProRealTime facilitates the automatic implementation of the Order Block Detector. The script is designed to analyze market data and highlight areas where Order Blocks may be forming. It uses a combination of volume and price comparisons to detect these critical levels.

Interpretation of Results

Interpreting detected Order Blocks is straightforward: a bullish block suggests a potential support area and an entry point for long positions, while a bearish block indicates resistance and an entry point for short positions. The trader should observe these blocks in conjunction with other technical analysis signals to validate and strengthen trading decisions.

Conclusions

Order Blocks are powerful tools for any technical trading arsenal. Their correct identification and analysis can provide traders with a significant advantage, offering entry and exit points based on the historical activity of the market’s most influential operators. With practice and integration of this indicator, traders can significantly improve their accuracy and operational efficiency.

Share this

Risk disclosure:

No information on this site is investment advice or a solicitation to buy or sell any financial instrument. Past performance is not indicative of future results. Trading may expose you to risk of loss greater than your deposits and is only suitable for experienced investors who have sufficient financial means to bear such risk.

ProRealTime ITF files and other attachments : How to import ITF files into ProRealTime platform?

PRC is also on YouTube, subscribe to our channel for exclusive content and tutorials

  1. Ciccarelli Franco • 15 days ago #

    Scusa, mi sembra molto simile al precedente indicatore postato da te “Demand/Supply Zone” , oppure sono diversi e io non capisco la differenza.
    Grazie

    • Iván • 15 days ago #

      Una differenza importante è che questo indicatore calcola i blocchi in base ai punti di rotazione del volume.

  2. Ciccarelli Franco • 14 days ago #

    E quindi dovrebbe essere più preciso nell’indicare le zone?

    • Iván • 11 days ago #

      No, semplicemente diverso

  3. soulintact • 13 days ago #

    Estimado Iván, gracias por publicar estos indicadores, ¡gran trabajo! Dos indicadores que realmente echo de menos de TradingView son: Chandelier Exit de Alex Orekhov y Nadaraya-Watson Envelope de LuxAlgo. Incluyo los códigos por si te gustaría programarlos en PRT, ¡gracias!

    //………………………………………………………………………………………………………………..//

    //@version=5
    // Copyright (c) 2019-present, Alex Orekhov (everget)
    // Chandelier Exit script may be freely distributed under the terms of the GPL-3.0 license.
    indicator(‘Chandelier Exit’, shorttitle=’CE’, overlay=true)

    var string calcGroup = ‘Calculation’
    length = input.int(title=’ATR Period’, defval=22, group=calcGroup)
    mult = input.float(title=’ATR Multiplier’, step=0.1, defval=3.0, group=calcGroup)
    useClose = input.bool(title=’Use Close Price for Extremums’, defval=true, group=calcGroup)

    var string visualGroup = ‘Visuals’
    showLabels = input.bool(title=’Show Buy/Sell Labels’, defval=true, group=visualGroup)
    highlightState = input.bool(title=’Highlight State’, defval=true, group=visualGroup)

    var string alertGroup = ‘Alerts’
    awaitBarConfirmation = input.bool(title=”Await Bar Confirmation”, defval=true, group=alertGroup)

    atr = mult * ta.atr(length)

    longStop = (useClose ? ta.highest(close, length) : ta.highest(length)) – atr
    longStopPrev = nz(longStop[1], longStop)
    longStop := close[1] > longStopPrev ? math.max(longStop, longStopPrev) : longStop

    shortStop = (useClose ? ta.lowest(close, length) : ta.lowest(length)) + atr
    shortStopPrev = nz(shortStop[1], shortStop)
    shortStop := close[1] shortStopPrev ? 1 : close math.exp(-(math.pow(x, 2)/(h * h * 2)))

    //—————————————————————————–}
    //Append lines
    //—————————————————————————–{
    n = bar_index

    var ln = array.new_line(0)

    if barstate.isfirst and repaint
    for i = 0 to 499
    array.push(ln,line.new(na,na,na,na))

    //—————————————————————————–}
    //End point method
    //—————————————————————————–{
    var coefs = array.new_float(0)
    var den = 0.

    if barstate.isfirst and not repaint
    for i = 0 to 499
    w = gauss(i, h)
    coefs.push(w)

    den := coefs.sum()

    out = 0.
    if not repaint
    for i = 0 to 499
    out += src[i] * coefs.get(i)
    out /= den
    mae = ta.sma(math.abs(src – out), 499) * mult

    upper = out + mae
    lower = out – mae

    //—————————————————————————–}
    //Compute and display NWE
    //—————————————————————————–{
    float y2 = na
    float y1 = na

    nwe = array.new(0)
    if barstate.islast and repaint
    sae = 0.
    //Compute and set NWE point
    for i = 0 to math.min(499,n – 1)
    sum = 0.
    sumw = 0.
    //Compute weighted mean
    for j = 0 to math.min(499,n – 1)
    w = gauss(i – j, h)
    sum += src[j] * w
    sumw += w

    y2 := sum / sumw
    sae += math.abs(src[i] – y2)
    nwe.push(y2)

    sae := sae / math.min(499,n – 1) * mult
    for i = 0 to math.min(499,n – 1)
    if i%2
    line.new(n-i+1, y1 + sae, n-i, nwe.get(i) + sae, color = upCss)
    line.new(n-i+1, y1 – sae, n-i, nwe.get(i) – sae, color = dnCss)

    if src[i] > nwe.get(i) + sae and src[i+1] < nwe.get(i) + sae
    label.new(n-i, src[i], '▼', color = color(na), style = label.style_label_down, textcolor = dnCss, textalign = text.align_center)
    if src[i] nwe.get(i) – sae
    label.new(n-i, src[i], ‘▲’, color = color(na), style = label.style_label_up, textcolor = upCss, textalign = text.align_center)

    y1 := nwe.get(i)

    //—————————————————————————–}
    //Dashboard
    //—————————————————————————–{
    var tb = table.new(position.top_right, 1, 1
    , bgcolor = #1e222d
    , border_color = #373a46
    , border_width = 1
    , frame_color = #373a46
    , frame_width = 1)

    if repaint
    tb.cell(0, 0, ‘Repainting Mode Enabled’, text_color = color.white, text_size = size.small)

    //—————————————————————————–}
    //Plot
    //—————————————————————————–}
    plot(repaint ? na : out + mae, ‘Upper’, upCss)
    plot(repaint ? na : out – mae, ‘Lower’, dnCss)

    //Crossing Arrows
    plotshape(ta.crossunder(close, out – mae) ? low : na, “Crossunder”, shape.labelup, location.absolute, color(na), 0 , text = ‘▲’, textcolor = upCss, size = size.tiny)
    plotshape(ta.crossover(close, out + mae) ? high : na, “Crossover”, shape.labeldown, location.absolute, color(na), 0 , text = ‘▼’, textcolor = dnCss, size = size.tiny)

    //—————————————————————————–}

    • Iván • 11 days ago #

      Hola
      Claro, no hay problema pero necesito que lo hagas a través de aquí: https://www.prorealcode.com/free-code-conversion/
      Si puedes compartir una imagen del indicador sería de gran ayuda

  4. Quino • 13 days ago #

    Félicitation Yvan.
    Cet indicateur est le plus intéressant et le plus pertinent que j’ai vu depuis longtemps. Il apporte une information précieuse sur la probabilité de réussite au moment de placer un trade short ou long. Il a une capabilité de prédiction sur l’évolution d’un cours bien meilleure que bien d’autres indicateur.

  5. roccafragius • 6 days ago #

    Felicitaciones Ivan, este indicador me parece muy útil y mucho más rápido que las zonas de oferta y demanda publicadas en el pasado en PRT. Estoy intentando usarlo para crear una estrategia automática de entrada y salida, pero no puedo entender en la barra actual si estoy cerca de un bloque rojo (posible cierre corto o largo) o cerca de una banda verde (posible cierre largo o corto). ¿Podrías crear una estrategia de entrada sobre esta base, para que luego cada uno pueda añadir otros filtros de entrada según su propia filosofía? ¡¡¡Gracias de antemano!!! Franco

  6. roccafragius • 5 days ago #

    Congratulations Ivan, this indicator seems to me to be very useful and much quicker than the offer and demand areas published in the past on PRT. I’m trying to use it to create an automatic entry and exit strategy, but I can’t read it in the actual bar if I’m looking for a red block (possible short or wide lock) or looking for a green band (possible wide or short lock). Could we create an entry strategy on this basis, so that at some point one can add other entry filters according to one’s philosophy? ¡¡¡Thanks in advance!!! Franco

  7. giumagi • 5 days ago #

    Hi Ivan …GREAT! thank you

  8. Regisnew • 3 hours ago #

    Hello Ivan, thank you for your good work, is it possible to create a sceener to find actions with close inside the green or red bock?

    • Iván • 24 mins ago #

      Hi! Yes it’s possible. I will add this to my list of tasks to do 🙂

avatar
Register or

Likes

avatar avatar avatar avatar avatar avatar avatar avatar avatar avatar avatar
Related users ' posts
kats j ai fait une copie d'ecran mais je ne sais pas comment l'envoyer sur le site
luiskohnen This indicator re-paint?
Iván Hi, Sorry, but what do you mean?
14starwberryhill Such a wonderful work, thanks Ivan..............
francis59 Hello Ivan, thanks for this very nice and powerfull indicator. Could you have time to create...
Iván Hi We could find stocks with sweep on: //PRC_Sweep Institucional //version = 0 //28.0...
inverse Like the way you think Ivan ... :)
Bodaris Bonjour, Merci pour ce super code que je n'aurais su faire moi-même, TOP. Je me demandais, s...
amiri bonjour Khaled pouvez vous me dire comment regler l'indicateur pour qu'il affiche les block...
pintris Hi, same request. Could someone help in creating a screener for this great indicator that sc...
YvesRobert Hi smp, how should I configure this indicator because everything is at zero -> High, Clos...
smp Hi, this is an end of day pivots indicator, so you need to find the end of day pivot info; t...
YvesRobert Thank you smp.
smp I also have an End Of Day (EOD) cash pivot indicator for use on cash markets; this indicator...
cdc.andersson Hej! Jag försöker lära mig att koda PRT. Jag vill testa en strategi med RSI-värde, ATR-värde...
Swingforfortune Du kan väl jämföra om open > close (röd) eller open < close (grön)
IV Mcm I don't speak English and the translation is not clear. Do you have a different turn of ...
IV Mcm stonk ?
avatar
Anonymous Thanks very much for sharing, look forward to testing this idea out.
Noobywan (My apologies for unformatted code, the formatting only works in forum or library posts not ...
Noobywan Hi FXTT, no problem for requests (as long as no one requests me singing), just usually it’s ...
JC_Bywan Bug fix at line 38, should be: if changebarre or (opentime[1]=start) then (same as in ...
Nicolas Oui le code est correct et il fonctionne, j'ai de bons résultats sur la liste NASDAQ par exe...
pincherman Bonjour :-) J'ai coller le script dans prorealtime pour jouer avec le supertrend et j'ai un...
Nicolas Vous l'avez sans doute collé au mauvais endroit, dans l'éditeur de code pour les stratégies,...
Bard Very interesting approach Vonasi! I'm getting a 404 error when trying to download though?
Vonasi I just tested and I was able to download with no error.
Psari Hi Vonasi, I am a newbie and was wondering whether you could possibly help me with this pro...
Juanjo Hola?. Exactamente cuál es su utilización?.
bolsatrilera Hola Juanjo, su principio esparecido a las bandas de Bollinguer.Las lineas de las bandas son...
Vonasi The indicator code can easily be adapted for use as a filter in strategies as well. For exam...
AVT Tested today in manual DAX trading (transcripted to MT and changed look into aka oszillator)...
Vonasi I think that short time frame charts will be too noisy for this indicator. One blue bar real...
Vonasi I forgot to mention in the description that Sunday pivot lines are ignored and Monday's pivo...
AVT Like that, simple and clear!
Vonasi Thanks AVT. I like simple - some people would say that I do simple very well! Sometimes you ...
Nicolas Please open a new forum topic, and respect the posting rules. Add a precise description of w...
FXTT ok will do, apologies, as I said I am new here. many thanks
Noobywan Version v2 including requested additions: https://www.prorealcode.com/prorealtime-indicators...
Trading_En_El_Ibex35 Para calcular el punto pivote y los niveles de soporte y resistencia para operar durante la ...
supertiti Hola mis disculpas, creia que tu eres Jose Antonio Madrigal ! gracias por las explicaci...
Trading_En_El_Ibex35 espero que las explicaciones te hayan sido de ayuda saludos
Paul Thanks for posting. I was currently searching how to improve day-trading based on support an...
Jessar Könntest du im Forum etwas öffnen und später darüber zu sprechen?
arahussein Hi All, I am new to trading and i find this indicator very logicail! Hence my (dumb?) quest...
juju333 Merci Nicolas, j'utilisais avec bonheur ce code dans la 10.3, il ne tourne plus dans la v11....
Nicolas Remplacer les lignes 11 et par 12 avec: yearlyHigh = Highest[max(1,BarIndex - lastYearBarI...
juju333 merci !!!
rajiwas Hello Nicolas, With Daily Pivot, it easy for me to show current day pivot e.g. if Date = T...
Nicolas You'll find many other pivots points indicators in the library, just use the search box of t...
rajiwas Thanks for the suggestion.

Top