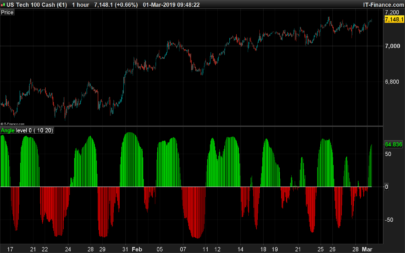
The moving average slope function is an extremely simple indicator and indicates several useful things:
– Direction of the given moving average, thus trend
– Gradient or slope of the given moving average thus momentum or power of the recent price action
– Volatility
– probability of continuation of price action.
This is a simple function which can prove to be valuable for algorithmic or manual trading. Use in conjunction with other indicators to find entries; or use as a filter to prevent bad entries. It’s best used with slower moving exponential averages but can also be used with a combination of averages. This can be considered as a building block for more complex indicators and trading systems.
Advantages
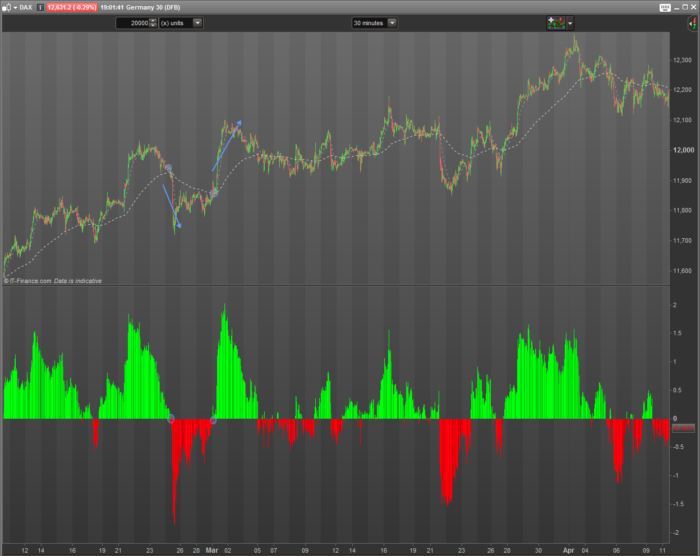
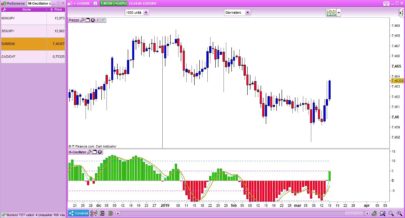
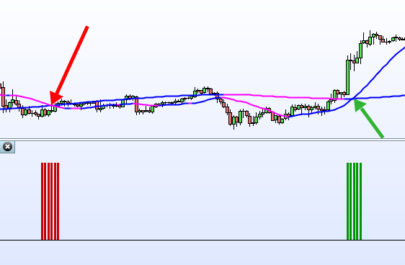
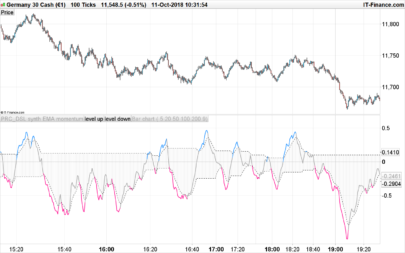
The histogram will give you a easy representation of acceleration or deceleration of a move. Oftentimes I see system code that checks whether a moving average is going up or going down in relation to its last few bars. This tool is more granular and will also allow you to test for when an average is curving off, or losing steam. That will allow you to enter a move sooner.
Interpretation:
A change in direction of the histogram back towards the zero line indicates the potential curving off of the underlining moving average and thus a reversal is more likely. In conjunction with other indicators, it may help to get into a move earlier than otherwise.
Zero crossings of the histogram suggest momentum is picking up in the direction of the crossing. Zero crossings become more significant if the previous wave was above a given threshold. It is up to you to set that threshold; low volatility crossings should be ignored.
Units are in points expressed as basis points per candle. If the chart was on a one-minute time frame and the histogram was showing +1, this would mean that the moving average was rising by one point per minute. A 30-minute time frame showing -3 would mean the moving average was falling by 6 basis points per hour.
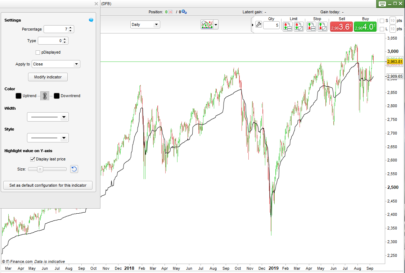
Variables
– maPeriod :: the moving average period. This is normally set at 200 by defailt
– maType :: the moving average method. Expotential average is the default
|
1 2 3 4 5 6 7 8 9 10 11 12 13 14 15 16 17 18 19 20 21 22 23 24 25 26 27 28 29 30 31 |
// ------------------------------ // Moving Average Slope // Author: Maz @ prorealcode.com // ------------------------------ // maPeriod = 200 // Moving Average Period // maType = 1 // Moving Average function - 1: exponential ma = average[maPeriod, maType](customClose) slope = ma - ma[1] // -- Colour management ----- if slope > 0 then if slope > slope[1] then g = 255 r = 0 elsif slope < slope[1] then g = 200 r = 0 endif elsif slope < 0 then if slope < slope[1] then r = 255 g = 0 elsif slope > slope[1] then r = 200 g = 0 endif endif return slope coloured(r, g, 10) style(histogram, 1) as "Moving Average Slope" |
Please reach out if there are any questions.
Share this
No information on this site is investment advice or a solicitation to buy or sell any financial instrument. Past performance is not indicative of future results. Trading may expose you to risk of loss greater than your deposits and is only suitable for experienced investors who have sufficient financial means to bear such risk.
ProRealTime ITF files and other attachments :
Find other exclusive trading pro-tools on ![]()
PRC is also on YouTube, subscribe to our channel for exclusive content and tutorials


Hi Maz, it’s always a pleasure to review your post, they are always perfectly well formatted with all the required files 🙂 Perfect for a sunny holiday day like today! 😉
Great work! Could be useful 🙂
Nice one, thanks a lot Maz 🙂
Thanks Man!!
Many thanks for sharing this, simple but a great indicator. Used it successfully for visual scanning of potential breakout and scalping. i use it with maPeriod = 50
Having a moving average bar running above 0 for the green bars and below 0 for the red bars would be a nice addition.
I mean a moving average line
I coded the above indicator into a strategy, seems to be profitable on the EURUSD 1Hr
I just have a question about trading.
What is better for use as a filter in trading (long): long term moving average slope upwards or price above it or both?
Thanks in advance
Buongiorno, è possibile codificare lo stesso codice per regressione lineare? grazie in anticipo
Just change the indicator at line 9 with a linearregression instead of average
Save Nicolas, non ci riesco puoi postarmelo grazie.
I need help to write this script on TD Ameritrade thinkorswim (TOS). How to make it work on TOS? Thanks…
We do not offer free assistance for TOS. However, you can send demand for private paid coding at: https://www.prorealcode.com/trading-programming-services/
Hi community. May I know how you use this indicator please? Is it on the zero cross over? or the histogram above or below a certain level? My understanding is zero cross over points to the direction, where as histogram above certain level points to the strength of the strength? So for a buy signal, look for a zero cross over, positive histogram above a certain number? What number on the y-axis will point to a healthy trend?
Hello, I’m digging up this topic because I uploaded the code on a PRT v11.1 but the indicator loads on the price chart without displaying any histogram. I can’t get it under the price chart. Something happens when I drag the indicator to the RSI panel for example but there is obviously a problem with scaling. Do we need to amend the code for the last PRT versions ? Thanks.