Moving Average Slope

Moving Average Slope

The moving average slope function is an extremely simple indicator and indicates several useful things:

Direction of the given moving average, thus trend
Gradient or slope of the given moving average thus momentum or power of the recent price action
Volatility
probability of continuation of price action.

This is a simple function which can prove to be valuable for algorithmic or manual trading. Use in conjunction with other indicators to find entries; or use as a filter to prevent bad entries. It’s best used with slower moving exponential averages but can also be used with a combination of averages. This can be considered as a building block for more complex indicators and trading systems.

Advantages

The histogram will give you a easy representation of acceleration or deceleration of  a move. Oftentimes I see system code that checks whether a moving average is going up or going down in relation to its last few bars. This tool is more granular and will also allow you to test for when an average is curving off, or losing steam. That will allow you to enter a move sooner.

Interpretation:
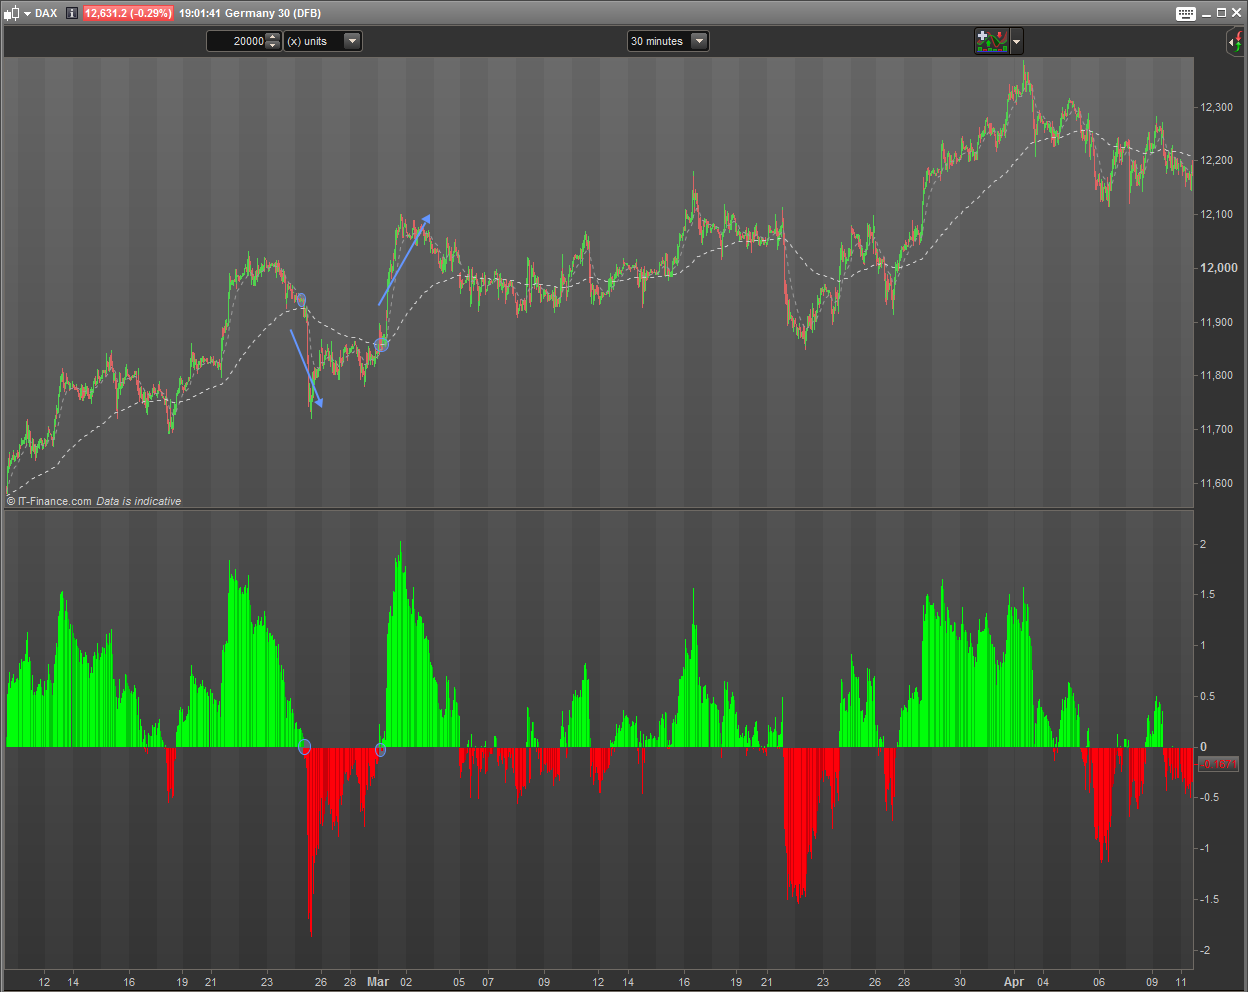
A change in direction of the histogram back towards the zero line indicates the potential curving off of the underlining moving average and thus a reversal is more likely. In conjunction with other indicators, it may help to get into a move earlier than otherwise.

Zero crossings of the histogram suggest momentum is picking up in the direction of the crossing. Zero crossings become more significant if the previous wave was above a given threshold. It is up to you to set that threshold; low volatility crossings should be ignored.

Units are in points expressed as basis points per candle. If the chart was on a one-minute time frame and the histogram was showing +1, this would mean that the moving average was rising by one point per minute. A 30-minute time frame showing -3 would mean the moving average was falling by 6 basis points per hour.

Variables
– maPeriod :: the moving average period. This is normally set at 200 by defailt
– maType :: the moving average method. Expotential average is the default

Please reach out if there are any questions.

Share this

Risk disclosure:

No information on this site is investment advice or a solicitation to buy or sell any financial instrument. Past performance is not indicative of future results. Trading may expose you to risk of loss greater than your deposits and is only suitable for experienced investors who have sufficient financial means to bear such risk.

ProRealTime ITF files and other attachments : How to import ITF files into ProRealTime platform?

PRC is also on YouTube, subscribe to our channel for exclusive content and tutorials

  1. Nicolas • 05/25/2017 #

    Hi Maz, it’s always a pleasure to review your post, they are always perfectly well formatted with all the required files 🙂 Perfect for a sunny holiday day like today! 😉

  2. Robert • 05/25/2017 #

    Great work! Could be useful 🙂

  3. Tedvin • 05/25/2017 #

    Nice one, thanks a lot Maz 🙂

  4. victormork • 05/25/2017 #

    Thanks Man!!

  5. MtraderWD40 • 05/25/2017 #

    Many thanks for sharing this, simple but a great indicator. Used it successfully for visual scanning of potential breakout and scalping.  i use it with maPeriod = 50

  6. juanj • 05/25/2017 #

    Having a moving average bar running above 0 for the green bars and below 0 for the red bars would be a nice addition.

  7. juanj • 05/25/2017 #

    I mean a moving average line

  8. juanj • 05/25/2017 #

    I coded the above indicator into a strategy, seems to be profitable on the EURUSD 1Hr

  9. Leo • 05/25/2017 #

    I just have a question about trading.
    What is better for use as a filter in trading (long): long term moving average slope upwards or price above it or both?
    Thanks in advance

  10. Marcot18 • 05/25/2017 #

    Buongiorno, è possibile codificare lo stesso codice per regressione lineare? grazie in anticipo

    • Nicolas • 05/25/2017 #

      Just change the indicator at line 9 with a linearregression instead of average

  11. Marcot18 • 05/25/2017 #

    Save Nicolas, non ci riesco puoi postarmelo grazie.

  12. Sumihiko Tachibana • 05/25/2017 #

    I need help to write this script on TD Ameritrade thinkorswim (TOS). How to make it work on TOS? Thanks…

    • Nicolas • 05/25/2017 #

      We do not offer free assistance for TOS. However, you can send demand for private paid coding at: https://www.prorealcode.com/trading-programming-services/

  13. phanz • 05/25/2017 #

    Hi community. May I know how you use this indicator please? Is it on the zero cross over? or the histogram above or below a certain level? My understanding is zero cross over points to the direction, where as histogram above certain level points to the strength of the strength? So for a buy signal, look for a zero cross over, positive histogram above a certain number? What number on the y-axis will point to a healthy trend?

  14. sydney43025 • 05/25/2017 #

    Hello, I’m digging up this topic because I uploaded the code on a PRT v11.1 but the indicator loads on the price chart without displaying any histogram. I can’t get it under the price chart. Something happens when I drag the indicator to the RSI panel for example but there is obviously a problem with scaling. Do we need to amend the code for the last PRT versions ? Thanks.

avatar
Register or

Likes

avatar avatar avatar avatar avatar avatar avatar avatar avatar avatar avatar avatar avatar avatar avatar avatar

+5 more likes

Related users ' posts
Gio56 Super idée. j'ai juste un souci. j'ai pas de barre verte mais plusieurs lignes de couleurs.....
DeathMetal change line in histgram, (click on indicator name, click on tool (
Gio56 Super merci.
jacquesgermain Bonjour non pas de soucis car src=customclose donc dans le menu configuration/propriété me...
geroniman Merci Jacques , indic tres utile. J'ai un indic à programmer avec du price action. es tu dis...
jacquesgermain ok pour regarder ...
Gianluca Amazing, thank You for your contribution!
Alex Spioglou Thank you for featuring my work, and I hope you found it useful. Mind the paper was publ...
Nicolas
1 year ago
f1_maik Ein sehr schöner Indikator, vielen Dank. Wenn ich den Indikator importiere und starte hat d...
Nicolas das ist in der Tat normal, Sie müssen die Auf- und Abwärtsfarbe direkt im Parameterfenster d...
FXtonio Bonjour Nicolas, merci pour cette merveille, je l'utilise en compl2ment du "magical buy sell...
supertiti Bel outil si on ne se tape pas sur les doigts avec ! Comment ajoute-on une image avec le co...
magnus59 Hi Nicolas, thaks for your great work here, I need a scanner for the swedish OMX when ma...
Nicolas Yes, sure please open a new topic in the ProScreener forum section, thank you.
paullyons Hello! Thanks for post your indicators. I'd like you to let me know how to draw lines for ...
Rafa Hi Nicolas! I can´t install this indicator. it installs in a separate window not as an av...
Nicolas Add it on the price, see how: https://www.prorealcode.com/blog/video-tutorials/how-to-add-an...
Frankyslo1 No consigo instalarlo en el precio en PRL-version 10
Roland57800 Bonjour Noobywan, si je comprends bien l'utilisation de ce code que je trouve particulièr...
Noobywan Bonjour, quand la question a été posée dans le forum à celui qui avait fait la requête en am...
Fabian This Code draws only a retangle if the condition has been confirmed and NOT before (in that ...
RakeshPoluri I have a question about the bands on the candles. Is it bollinger bands or something else?
Nicolas I think that's 2 Bollinger Bands
Emperor.it "style(line,2)" C'è una guida ai parametri che si possono modificare ? Tipo stile della lin...
IV Mcm https://www.prorealcode.com/programming-with-prorealtime/
fazel53 How do i attach this indicator to my mt5 platform?
Nicolas You can't! All indicators here are for ProRealTime trading platform: https://www.prorealtime...
Nicolas c'est exactement ce que je fais entre les lignes 58 et 64 pour pouvoir tracer la ligne complète
Italo Fabian Nicolas, Ces matrices sont-elles des vecteurs unidimensionnels ou multidimensionnels? Depu...
Denis Bonjour Nicolas et RicLg, Merci Nicolas pour cet indicateur intéressant et merci RicLg pour...
Nicolas Il faut l'ajouter sur le prix avec l'icône de la clé situé en haut à gauche du graphique du ...
jerome777 merci de ta réponse
jerome777 bonjour c est bon il fonctionne parfaitement merci beaucoup
Madrosat I Have not see a fully functioning automated strategy on your site?? Really have you???
juanj Hi Madrosat, why would it be on my site? I have developed it for my personal use and also to...
Madrosat ok I understood you are using prorealcode to hack the fish
jaginho Bonjour Vivien, je n'arrive pas à comprendre ce screener... En tout cas merci pour tes contr...
avatar
Anonymous Superb, merci!

Top