Renko bars with wicks on price chart

v10.3
Renko bars with wicks on price chart

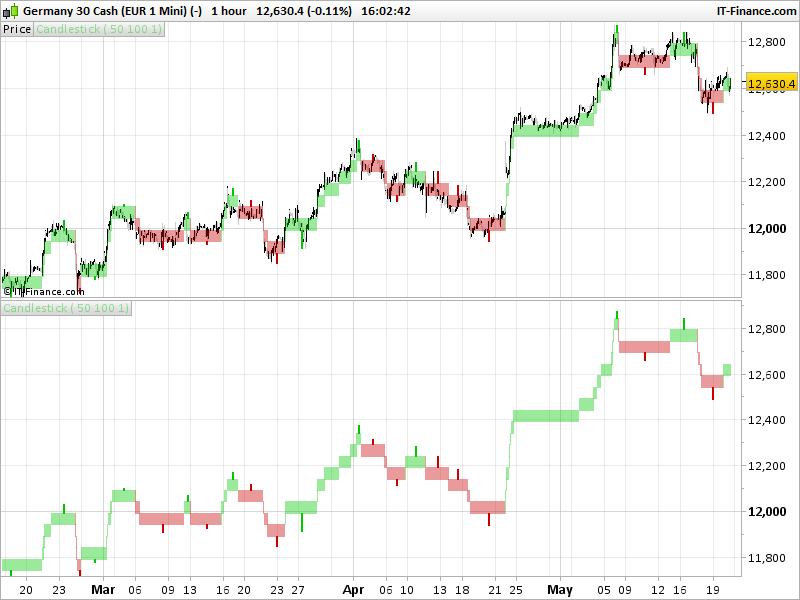
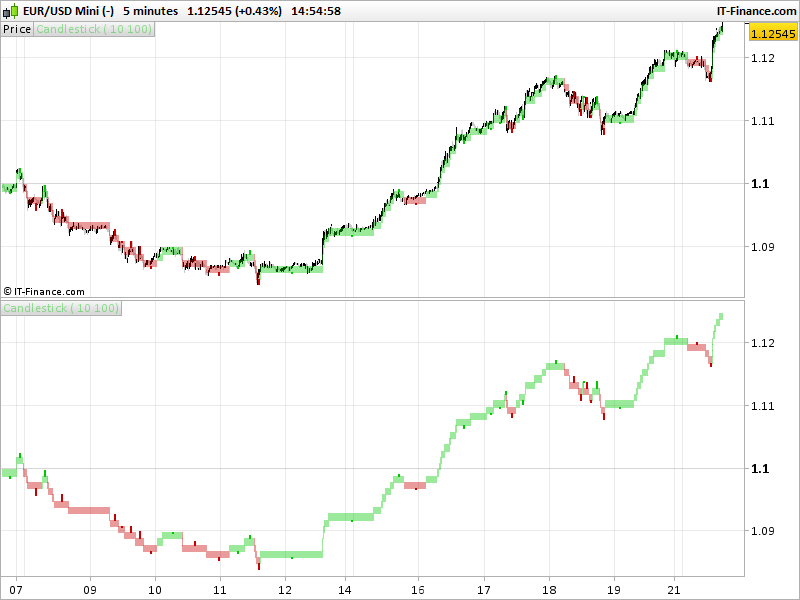
The renko candlesticks style of prorealtime platform does not have wicks. Someone asked me to create a customized indicator to draw them. Because it is not possible to draw candlesticks on a non time dependent chart in the platform and because the renko bricks of prorealtime are “repainting”, this indicator must be applied on a “normal” chart, on any timeframe. It can be overlaid directly on the price or displayed in a window below it.

This indicator complete the other renko boxes indicators already available in the library, posted while ago:

https://www.prorealcode.com/prorealtime-indicators/renko-boxes-on-price-chart/

https://www.prorealcode.com/prorealtime-indicators/median-renko-boxes-on-price/

The renko boxes size can be modified in the indicator settings. I introduced parameters to change their designs : transparency (alpha of the candlesticks) and the wicks sizes (how much bars in width the wicks will be displayed).

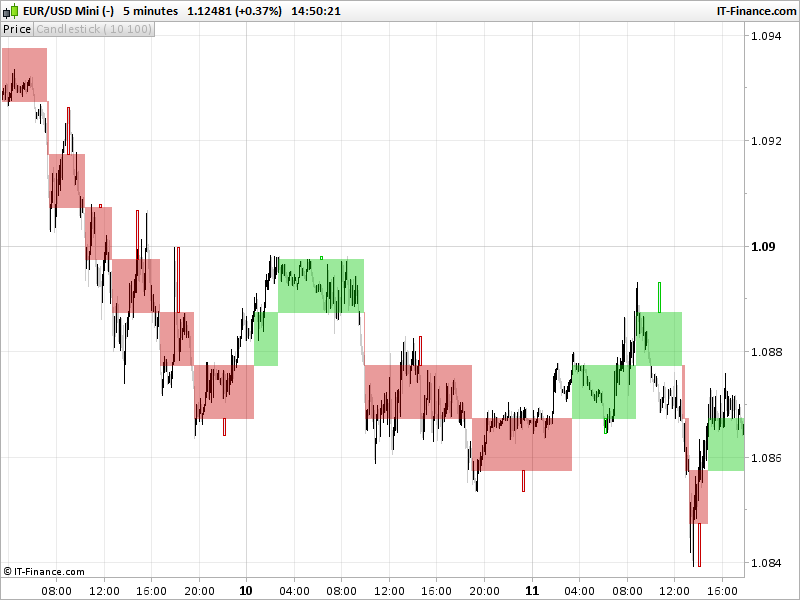
The tails/wicks of a Renko candlestick represent the high and low prices achieved in each bar, just like in any other timeframe. But these highs and lows are not enough consequent to draw new a renko bar. Please note, that they are only drawn after a new brick is displayed because it uses rectangle graphical component introduced in the 10.3 version, that can’t be erased afterwards.


Share this

Risk disclosure:

No information on this site is investment advice or a solicitation to buy or sell any financial instrument. Past performance is not indicative of future results. Trading may expose you to risk of loss greater than your deposits and is only suitable for experienced investors who have sufficient financial means to bear such risk.

ProRealTime ITF files and other attachments : How to import ITF files into ProRealTime platform?

PRC is also on YouTube, subscribe to our channel for exclusive content and tutorials

  1. Maz • 05/22/2017 #

    Heh, cute 🙂

  2. Sofitech • 05/22/2017 #

    Very Nice. the wicks are nice to detect where price is rejected. Is there a way to have a dot at the top / bottom of the wick so we can create alert based on it. What should be the “Return” instruction to do that ?

  3. TheAccountant • 05/22/2017 #

    Bonjour et merci pour cet indicateur. Le renko de PRT  repeint sur plusieur box et n’est donc pas exploitable pour du traiding en live.
    Celui ci couplé avec des MA donne des resultats interressant ( même si la derniere box repeint parfois). Une question quand meme : si j’utilise l’utilitaire de proOrder pour creer une stratégie automatique, l’outil me dit que l’indicateur ne retourne pas de valeur et je ne peux pas l’utiliser. Auriez vous une solution ?
    Merci encore.

    • Nicolas • 05/22/2017 #

      En effet, j’ai déjà soulevé le problème, j’espère que cela pourra être modifié dans une future version ! Au sujet de l’indicateur, effectivement celui-ci ne renvoi aucune information, c’est un simple graphique. Qu’est ce qui serait utile ? Le Close de chaque bougie Renko uniquement ?

  4. TheAccountant • 05/22/2017 #

    hmmm… je ne sais pas 🙂
    en fait très concretment : pour le dax ou pour l’eur/usd par exemple( affichage en 50 ticks)  box size =1  et on affiche l indicateur sous le prix.  Puis on applique deux moyennes mobiles expo ( 10 et 5) sur l’indicateur renko. Prise de position aux croisements des moyennes mobiles et sorties croisement inverse. Je fais ça en live depuis ce matin sur dax+eurusd et pour l’instant ça fonctionne bien. J’aurai voulu bactester ça et voir faire une stratégie auto si les resultats se confirment.

    • Nicolas • 05/22/2017 #

      Le problème de procéder de cette manière c’est que le calcul de la moyenne mobile continue même si la bougie Renko ne bouge pas, puisque la EMA se calculera avec une quantité de périodes de temps qui s’écoule, alors que la bougie Renko, elle, devrait rester figée dans le temps. Par conséquent la valeur de la EMA n’est pas correcte. Cependant sur des bougies Renko en 1 pip/point, avec un marché plutôt rapide, le phénomène sera beaucoup moins ressentit.

  5. TheAccountant • 05/22/2017 #

    hmmmmmmm… même si j’applique les EMA sur l’indicateur lui même et pas dans la fenetre prix ? sachant egalement que je suis en 50 ticks ? parceque je ne vois bouger les EMA que lorsque les renko avancent.

    • Nicolas • 05/22/2017 #

      Le temps continue de s’écouler sur un graphique “normal” comme c’est le cas ici, alors que ça n’est pas le cas sur un graphique non lié au temps mais uniquement au prix comme pour les Renko (ou les ticks charts, les ranges bars, etc.). Donc si tu utilises une EMA 5 périodes et que la barre renko n’a pas changé durant 5 périodes, alors la EMA se calculera de façon erronée en considérant 5 fois le même prix (alors que sur un graphique Renko, 5 périodes signifie 5 barres différentes à 5 prix différents).
      Bref, le principal c’est que tu arrives à en sortir quelque chose ! 🙂

    • TheAccountant • 05/22/2017 #

      ok j’ai compris le truc ! merci !

  6. Sofitech • 05/22/2017 #

    Le “Point” qui sera à mon sens le plus utile à faire apparaître est le top du wick quand c’est un wickhaut dessus du renko, et le bottom lorsqu’il s’agit d’un wick bas sous le renko.Cela permettrait un usage relativement efficace si cela est possible à faire.

    • Nicolas • 05/22/2017 #

      C’est déjà le cas, je ne comprends pas la remarque 🙂 

    • Sofitech • 05/22/2017 #

      oui, cela apparaît visuellement. Je voulais dire que ces 2 ponts haut et bas sont uniquement visuels, ils ne renvoient pas valeur exploitable par une alerte ou une stratégie.

    • Nicolas • 05/22/2017 #

      RETURN highwick, lowwick

  7. Pasq • 05/22/2017 #

    Merci pour cet indicateur intéressant
    Par contre apres import de l’itf et utilisation sur un graphe journalier, les wicks ne sont pas de la bonne taille.
    Ca devrait donner le plus haut ou le plus bas des chandeliers inclus dans la boite, c’est bien ca ou j’ai mal compris ?
    Il semblerait que le premier ne soit pas pris en compte, des fois le 2e.
    https://www.dropbox.com/s/8yoannvgptzctm4/Capture-1.jpg?dl=0

    • Nicolas • 05/22/2017 #

      Merci pour ce retour, en effet je vois une différence entre la taille des wicks et les highs/lows sur votre graphique en daily, quelle est la taille des boîtes svp ? je regarde à cela dés que possible 🙂

    • Pasq • 05/22/2017 #

      Je teste sur les actions donc j’ai passé la taille en décimal a 0.5 (Soit 50centimes comme hauteur de box) et je teste sur Rno (Renault) en journalier ( Avec un graphe en Heiken Ashi ). Je pensais que c’était le heiken qui posait probleme mais les low et les High sont bien les mêmes qu’en chandeliers japonais. Il serait peut être plus simple de remplacer les wicks par une courbe et point sur les plus haut/bas de la box en cours ?

    • Nicolas • 05/22/2017 #

      Cela ne changerai pas leurs calculs, pour les courbes ou points. Le paramètre dès tailles de bougies renko est à indiquer en points, le code l’adapte ensuite automatiquement à la taille des l’instrument.

  8. DonDollar • 05/22/2017 #

    OK, I would like to follow the discussion, but my french is not the best. What was the topic?

    • Nicolas • 05/22/2017 #

      Pasq was talking about something odd with the indicator applied on stocks.

  9. Madrosat • 05/22/2017 #

    Sofitech • 278 days ago #
    oui, cela apparaît visuellement. Je voulais dire que ces 2 ponts haut et bas sont uniquement visuels, ils ne renvoient pas valeur exploitable par une alerte ou une stratégie.

    avatar
    Nicolas • 278 days ago #
    RETURN highwick, lowwick
    Bonjour Nicolas je suis entrain de lire et essaie de comprendre ce sujet
    sur la demande de Sofitech il y a 278 jours , c’est pas d’hier !
    tu réponds ” return highwick lowwick ” J’ai essayé mais cela ne retourne pas les points hauts et bas il manque quelque chose
    Maintenant est ce possible?
    cela a peut être été abordé si oui donne moi le lien
    Merci bonne apm

    • Nicolas • 05/22/2017 #

      highwick et lowwick sont retournés correctement au moment de leurs créations. Ils sont ensuite affectés à des valeurs dîtes d’attentes, c’est peut être pourquoi tu penses qu’il manque quelquechose.

  10. Madrosat • 05/22/2017 #

    Bonsoir Nicolas il est évident que les wicks (petits rectangles en dessous ou en dessus des boites semblent des points d’entrée intéressants je voulais les essayer en trading automatique.
    Mais dois je comprendre que c’est comme le zig zag les points sont tracés après que le cours a bougé de x % ou x points ou a avancé de x bougies?

    • Nicolas • 05/22/2017 #

      Oui puisque les briques sont tracées après le mouvement de X points.

  11. Pere • 05/22/2017 #

    Hi Nicolas. Thank you again for this excelent indicator. But, what is the purpose of the wicks? What can I do with them? And also, what is the purpose of making the wicks bigger than one candle?
    I put on DAX two Renko indicators on the same screen: one of them with Box=1 and the other one with Box=2. Curiously, sometimes reacts first changing the colour the indicator with Box=2. Which can be the reason?

    • Nicolas • 05/22/2017 #

      Wicks are highs and lows of the bricks. If the price has not go far enough to make a new brick, then this is a new high or low, so the wicks. You can use them as support or resistance or whatever 🙂
      One indicator react differently than the other one because the calculation begin at first tick when you put the indicator on, so if they are not set on the price chart at the exact same time, calculation differs obviously..

  12. serman • 05/22/2017 #

    nice. Is it possible instead of a fixed box to have a variable one, based on ATR for example? Thanks

    • Nicolas • 05/22/2017 #

      I think you can find it (and many other modded ones), in this topic:
      https://www.prorealcode.com/topic/new-renko-system/

  13. papmanindia • 05/22/2017 #

    HI Nicolas,
    I am not that genius like all of you techines. I belong from Commerce sector have limited knoweldge os say NIL on programming. Would you please share the bactest report, if you have conducted. and on which platform this code will work. I tried using tradeview.com, it seems not working on that.

    • Nicolas • 05/22/2017 #

      This code is an indicator to plot the renko bricks on a standard price chart. It is not intended to be traded automatically. Our website is dedicated to the ProRealTime trading platform https://www.prorealtime.com , not tradingview programming. If you are looking for custom programming for other softwares, you can ask for a quote to our programming services: https://www.prorealcode.com/trading-programming-services/

  14. Thomas • 05/22/2017 #

    Hi Nicolas. I would like to use the indicator with ATR. How could I adjust the brick size to ATR?

    • Nicolas • 05/22/2017 #

      Change the line with the “size” settings with:
      size=averagetruerange[14]

  15. pp_playaflamenca • 05/22/2017 #

    Would you explain to us what have you said about “renko bricks of prorealtime are “repainting””, please?
    Is really that the case?
    1) I could understand PRT renko bricks could be repainting if we fix bricks size by means ATR, because ATR itself will be changing as candlesticks move on…Is that the reason you’re saying PRT Renko bricks are repainting, maybe?
    2) what about if we fix Renko bricks size to have any permanent constant value? (I think PRT v11 allows that choice) PRT Renko graphics would repaint in this case?
    3) does your Renko bricks indicator (that you give to us here) repaint at all?
    4) any attempt to build Renko bricks depend of the value parameters (close, etc) of the first candlestick on chart….So as time goes by, this first candlestick is replacing by others, does it mean every Renko chart will repaint?
    Thank you.

    • Nicolas • 05/22/2017 #

      PRT renko bricks does not repaint if you use 1-tick chart to build them.

  16. pp_playaflamenca • 05/22/2017 #

    One last question I forgot, Nicholas please: It´s possible to use Renko Bricks or charts In Prorealtime for screeners?
    Thank you very mutch

    • Nicolas • 05/22/2017 #

      in order to use renko bricks in a trading strategy or in a screener, I would recommenced this excellent indicator that recreate the same charts as PRT: https://market.prorealcode.com/product/prt-renko/

  17. pp_playaflamenca • 05/22/2017 #

    I understand. I visited the page https://market.prorealcode.com/product/prt-renko/

    Actually this indicator is not free. So my main point of interest is really if Renko bricks are repainting at all or not. Because I would consider useless paying any money in that case. Thank you in advance.

    • Nicolas • 05/22/2017 #

      renko bricks are not repainting, they are using the price movement in their definition. But since the default renko bricks of the platform are using the bar Close value, they will not have the same behavior on a classic timeframe (such as 1-minute for instance) as with a 1-tick chart (since close of a 1-tick chart, is just 1 tick).

avatar
Register or

Likes

avatar avatar avatar avatar avatar avatar avatar avatar avatar avatar avatar avatar avatar avatar avatar
Related users ' posts
Nicolas Good job Gabri, I confirm that with the new ProRealTime v11, everyone will be able to use in...
Slowlyslowly can u just help me with the exact definition of percbox , mm and period to understand will a...
YvesRobert Merci beaucoup Nicolas. Existe t'il un petit programme qui permet de tracer sur la graphe en...
Nicolas Oui il y a celui ci: https://market.prorealcode.com/product/prt-renko/?lang=fr
YvesRobert Bonjour Nicolas, j'ai une question technique à te poser. Je visualise souvent le cours en RE...
Nicolas
6 years ago
stratobast Good afternoon everyone. Thanks Doctrading for your work. I have an issue while using this ...
stratobast My bad guys. I understood what was the problem. The indicator uses highs and lows for the Re...
samwarduk Has anyone tried this on Bitcoin GBP1? The results look amazing but every time mine trie...
verdi55
7 years ago
Marcel Hi, I tested this strategy on Spot Gold with a brick size of 20 on the weekly timeframe with...
Nicolas Because the renko chart construction begin at the first price of the loaded history. So you ...
JOKAMAURICE I am learning to code. I try to understand these lines newbricksup = (round(((close - upbr...
Nicolas No. This website is about prorealtime trading platform, not MT4 sorry. However, you can ask ...
Wilko Interesting code, thanks! It will provide me with a good starting point for further developm...
Nicolas contrarian renko boxes are 2 times taller than the brick size.
Doctrading
8 years ago
Nicolas Use Highs and Lows instead
Doctrading This new code with highs and lows seems to work : boxSize = 20 // On aime bien que...
DonDollar Gentlemen, just a quick question. When I am adding this column to my code, PRT shows an err...
Nicolas
8 years ago
Alessio Nicolas Hello, I have recently started using this platform, I would like to test a system th...
Nicolas Please use forums for trading strategies queries. Many thanks. 
PassionTrading Salut Nicolas, Je regarde cette indicateur très intéressant par le fait qu'il est superposé...
Nicolas
8 years ago
cedwimmer Hab es schon gefunden vielen Dank!:)
guidocir Hello Nicolas, I imported your code, but it doesn't draw many boxes, but just a single one...
Nicolas It depends of your settings. Try to reduce the box size or to expand the units displayed.

Top