This is an adaptation for Prorealtime v 10.3 of an indicator of the Tradingview platform.
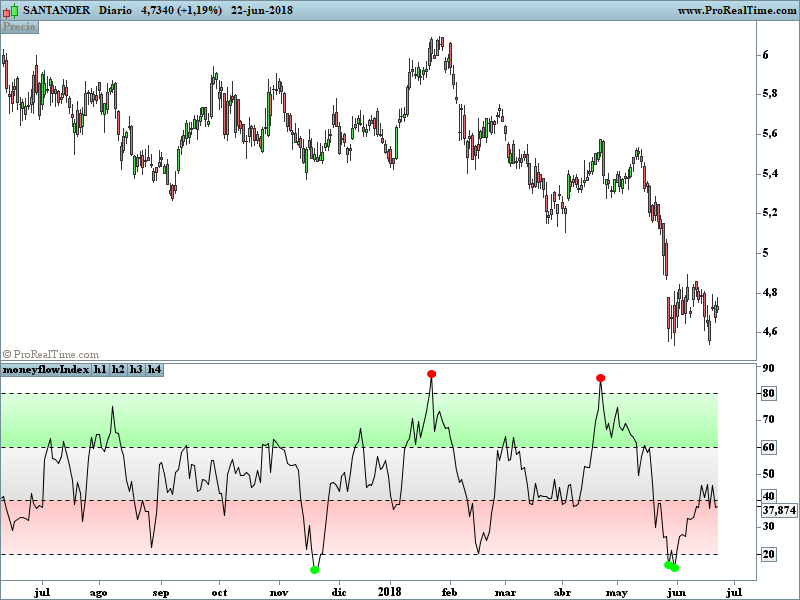
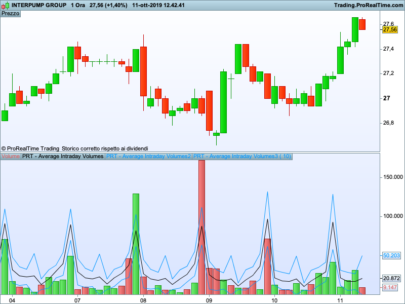
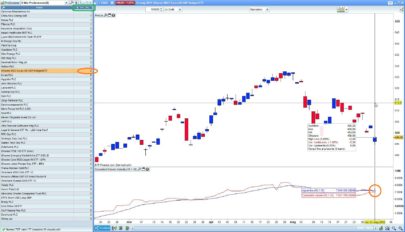
1. Added a visual symbol of an overbought/oversold threshold cross in the form of a red/green circle, respectively. Sometimes it can be hard to see when a cross actually occurs, and if your scaling isn’t set up properly you can get misleading visuals. This way removes all doubt. Bear in mind they aren’t meant as trading signals, so DO NOT use them as such. Research the Money flow Index if you’re unsure, but I use them as an early warning and that particular market/stock is added to my watchlist.
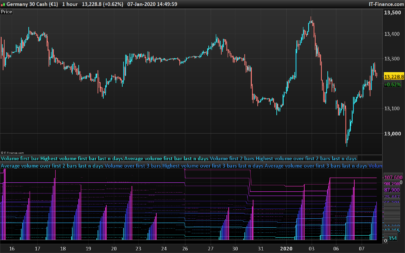
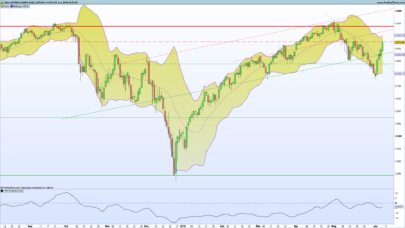
2. Added 60/40 lines as the Money flow Index respects these incredibly well in trends. E.g. in a solid uptrend the Money flow Index won’t go below 40, and vice versa. Use the idea of support and resistence levels on the indicator and it’ll be a great help. I’ve coloured the zones. Strong uptrends should stay above 60, strong downtrends should stay below 40. The zone in between 40-60 I’ve called the transition zone. Money Flow Index often stays here in consolidation periods, and in the last leg of a cycle/trend the Money Flow Index will often drop into this zone after being above 60 or below 40. This is a great sign that you should get out and start looking to reverse your position. Hopefully it helps to spot divergences as well.
3. Added alerts based on an overbought/oversold cross. Also added an alert for when either condition is triggered, so hopefully that’s useful for those struggling with low alert limits. Feel free to change the overbought/oversold levels, the alerts + crossover visual are set to adapt.
Like any indicator, don’t use this one alone. It works best paired with indicators/techniques that contradict it. You’ll often see a OB/OS cross, and price will continue on it’s way for many weeks more. But Money flow Index is a great tool for identifying upcoming trend changes.
|
1 2 3 4 5 6 7 8 9 10 11 12 13 14 15 16 17 18 19 20 21 22 23 24 25 26 27 28 29 30 31 32 33 34 35 36 37 38 39 40 41 42 43 44 45 46 47 48 49 50 51 52 53 54 55 56 57 58 59 60 61 62 63 64 65 66 67 68 69 70 71 72 73 74 75 76 77 78 79 |
REM MONEY FLOW INDEX + ALERTS //@version=3 // on platform Tradingview by DreamsDefined //adapted by platform Prorealtime v10.3 by bolsatrilera // This study is based on the work of TV user Beasley Savage (https://www.tradingview.com/script/g58H59ub-Money-Flow-Index-Beasley-Savage/) // and all credit goes to them. // // Changes I've made: // // 1. Added a visual symbol of an overbought/oversold threshold cross in the form of a red/green circle, respectively. // Sometimes it can be hard to see when a cross actually occurs, and if your scaling isn't set up properly you can get // misleading visuals. This way removes all doubt. Bear in mind they aren't meant as trading signals, so DO NOT use them as such. // Research the MFI if you're unsure, but I use them as an early warning and that particular market/stock is added to my watchlist. // // 2. Added 60/40 lines as the MFI respects these incredibly well in trends. E.g. in a solid uptrend the MFI won't go below 40, // and vice versa. Use the idea of support and resistance levels on the indicator and it'll be a great help. // I've coloured the zones. Strong uptrends should stay above 60, strong downtrends should stay below // 40. The zone in between 40-60 I've called the transition zone. MFI often stays here in consolidation periods, and // in the last leg of a cycle/trend the MFI will often drop into this zone after being above 60 or below 40. This is a great // sign that you should get out and start looking to reverse your position. Hopefully it helps to spot divergences as well. // // 3. Added alerts based on an overbought/oversold cross. Also added an alert for when either condition is triggered, so hopefully // that's useful for those struggling with low alert limits. Feel free to change the overbought/oversold levels, the alerts + // crossover visual are set to adapt. // // Any queries please comment or PM me. // // Cheers, // RJR //Inputs length = 14 os = 20 // title = "Oversold") ob = 80//title = "Overbought") //MFI Calc hlc3 = (high+low+close)/3 rawMoneyFlow = hlc3 * volume positiveMoneyFlow = 0.0 if hlc3 > hlc3[1] then positiveMoneyFlow = positiveMoneyFlow + rawMoneyFlow else positiveMoneyFlow = positiveMoneyFlow endif negativeMoneyFlow = 0.0 if hlc3 < hlc3[1] then negativeMoneyFlow = negativeMoneyFlow + rawMoneyFlow else negativeMoneyFlow = negativeMoneyFlow endif moneyFlowRatio = average [length](positiveMoneyFlow) /average[length](negativeMoneyFlow) mfi = 100 - 100 / (1 + moneyFlowRatio) if mfi crosses under os then drawtext("●",barindex,mfi,Dialog,Bold,10) coloured(0,255,0) endif if mfi crosses over ob then drawtext("●",barindex,mfi,Dialog,Bold,10) coloured(255,0,0) endif h1 = 80 //"Overbought") h2 = 20 //"Oversold") h3 = 40 //"Bears") h4 = 60 //"Bulls") //(h4, h1, color=green, title="Uptrend") //(h3, h2, color=red, title="Downtrend") //(h3, h4, color=gray, title="Transition Zone") return mfi as "moneyflowIndex",h1 style(dottedline)as "h1",h2 style(dottedline)as "h2",h3 style(dottedline) as "h3",h4 style(dottedline)as "h4" |
Share this
No information on this site is investment advice or a solicitation to buy or sell any financial instrument. Past performance is not indicative of future results. Trading may expose you to risk of loss greater than your deposits and is only suitable for experienced investors who have sufficient financial means to bear such risk.
ProRealTime ITF files and other attachments :
Find other exclusive trading pro-tools on ![]()
PRC is also on YouTube, subscribe to our channel for exclusive content and tutorials


Yo pondría las alertas (círculos) cuando vuelve a cruzar por debajo/arriba de los niveles de sobrecompra/sobreventa una vez han sido traspasados.
Y yo. Cómo lo programaríais?
con un pequeño añadido. He puesto los circulos en color negro.
EM MONEY FLOW INDEX + ALERTS
//@version=3
// on platform Tradingview by DreamsDefined
//adapted by platform Prorealtime v10.3 by bolsatrilera
// This study is based on the work of TV user Beasley Savage (https://www.tradingview.com/script/g58H59ub-Money-Flow-Index-Beasley-Savage/)
// and all credit goes to them.
//
// Changes I’ve made:
//
// 1. Added a visual symbol of an overbought/oversold threshold cross in the form of a red/green circle, respectively.
// Sometimes it can be hard to see when a cross actually occurs, and if your scaling isn’t set up properly you can get
// misleading visuals. This way removes all doubt. Bear in mind they aren’t meant as trading signals, so DO NOT use them as such.
// Research the MFI if you’re unsure, but I use them as an early warning and that particular market/stock is added to my watchlist.
//
// 2. Added 60/40 lines as the MFI respects these incredibly well in trends. E.g. in a solid uptrend the MFI won’t go below 40,
// and vice versa. Use the idea of support and resistance levels on the indicator and it’ll be a great help.
// I’ve coloured the zones. Strong uptrends should stay above 60, strong downtrends should stay below
// 40. The zone in between 40-60 I’ve called the transition zone. MFI often stays here in consolidation periods, and
// in the last leg of a cycle/trend the MFI will often drop into this zone after being above 60 or below 40. This is a great
// sign that you should get out and start looking to reverse your position. Hopefully it helps to spot divergences as well.
//
// 3. Added alerts based on an overbought/oversold cross. Also added an alert for when either condition is triggered, so hopefully
// that’s useful for those struggling with low alert limits. Feel free to change the overbought/oversold levels, the alerts +
// crossover visual are set to adapt.
//
// Any queries please comment or PM me.
//
// Cheers,
// RJR
//Inputs
length = 14
os = 20 // title = “Oversold”)
ob = 80//title = “Overbought”)
//MFI Calc
hlc3 = (high+low+close)/3
rawMoneyFlow = hlc3 * volume
positiveMoneyFlow = 0.0
if hlc3 > hlc3[1] then
positiveMoneyFlow = positiveMoneyFlow + rawMoneyFlow
else
positiveMoneyFlow = positiveMoneyFlow
endif
negativeMoneyFlow = 0.0
if hlc3 < hlc3[1] then
negativeMoneyFlow = negativeMoneyFlow + rawMoneyFlow
else
negativeMoneyFlow = negativeMoneyFlow
endif
moneyFlowRatio = average [length](positiveMoneyFlow) /average[length](negativeMoneyFlow)
mfi = 100 – 100 / (1 + moneyFlowRatio)
if mfi crosses under os then
drawtext("●",barindex,mfi,Dialog,Bold,10) coloured(0,255,0)
endif
if mfi crosses over os then
drawtext("●",barindex,mfi,Dialog,Bold,10) coloured(0,0,0)
endif
if mfi crosses over ob then
drawtext("●",barindex,mfi,Dialog,Bold,10) coloured(255,0,0)
endif
if mfi crosses under ob then
drawtext("●",barindex,mfi,Dialog,Bold,10) coloured(0,0,0)
endif
h1 = 80 //"Overbought")
h2 = 20 //"Oversold")
h3 = 40 //"Bears")
h4 = 60 //"Bulls")
//(h4, h1, color=green, title="Uptrend")
//(h3, h2, color=red, title="Downtrend")
//(h3, h4, color=gray, title="Transition Zone")
return mfi as "moneyflowIndex",h1 style(dottedline)as "h1",h2 style(dottedline)as "h2",h3 style(dottedline) as "h3",h4 style(dottedline)as "h4"
Enorme. Gracias!
Buen indicador….
Gracias