







Ichimoku Trend or Range? Created by Rohan Posthumus
Hello everybody,
I have tested a lot of systems and indicators and fell in love with the Ichimoku indicator. I am currently on a mission to quantify trading aspects of the indicator in order to backtest and optimize it.
One of the things that I often read about the Ichimoku indicator is that “it loses its validity in range markets”. What I have done here is to create my own indicator in order to reverse engineer the statement – when the Ichimoku loses its validity, the markets is ranging.
The indicator works as follows:
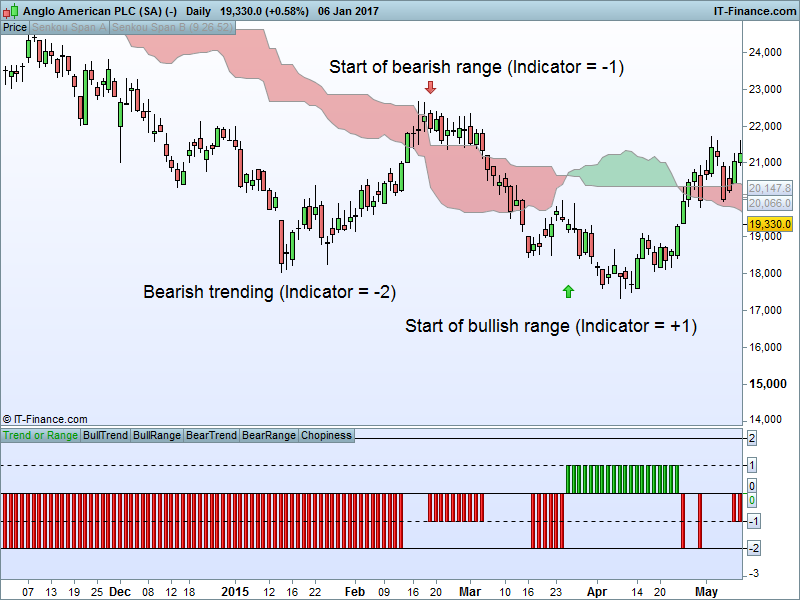
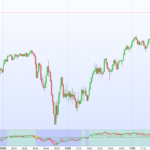
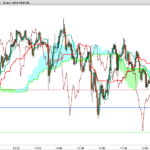
When both the current and future cloud have the same color, the market is trending, but when there is color changes, the market is ranging. The indicator gives a value of +2 or -2 for bullish or bearish trending respectively. The indicator gives +1 or -1 when the market is bullish or bearish range respectively. A value of 0 indicates chopiness or that the close is in the cloud (do not trade). This indicator serves as a setup indicator – it only shows when to long or short and what strategy to follow and is not intended to be used as entry signals. For example, when the indicator is +1 you have a bullish range setup, and when the RSI(14) is coming out of overbought you have a buy entry. Or if you have a -2 and the RSI(14) crosses down 50 you have a swing trade short entry. A weakness of the indicator is that it does not allow Kumo breakouts and therefore misses the start of trends. It is good for swing trading and range trading.
I am new to programming and ProRealTime, so I welcome any improvements. Below is the code.
//Ichimoku
Tenkansen = (highest[9](high)+lowest[9](low))/2
Kijunsen = (highest[26](high)+lowest[26](low))/2
SpanA = (tenkansen[26]+kijunsen[26])/2
SpanB = (highest[52](high[26])+lowest[52](low[26]))/2
FutureSpanA = (tenkansen+kijunsen)/2
FutureSpanB = (highest[52](high)+lowest[52](low))/2

//Ichimoku Trend or Range
TrendorRange = 0

if close > SpanA and close > SpanB and SpanA > SpanB and FutureSpanA > FutureSpanB then
 TrendorRange = 2
elsif close < SpanA and close < SpanB and SpanA < SpanB and FutureSpanA < FutureSpanB then
 TrendorRange = -2
elsif close > SpanA and close > SpanB and SpanA < SpanB and FutureSpanA > FutureSpanB then
 TrendorRange = -1
elsif close < SpanA and close < SpanB and SpanA > SpanB and FutureSpanA < FutureSpanB then
 TrendorRange = 1
else
 TrendorRange = 0
endif

BullTrend = 2
BullRange = 1
BearTrend = -2
BearRange = -1
Chopiness = 0


Return TrendorRange as "Trend or Range", BullTrend as "BullTrend", BullRange as "BullRange", BearTrend as "BearTrend", BearRange as "BearRange", Chopiness as "Chopiness"
Comments
You must be logged in to post a comment.



Good morning,
Just to clarify, the main idea here is to compare the cloud directly above/below price with the cloud in the future. E.g. should they be the same color, price are making higher highs and higher lows i.e. trending. To do this, you have to take today's cloud (which is the previous period's future cloud) and compare it to today's future cloud. So you are not comparing one cloud that moves but you are comparing 2 clouds both moved forward. Do to a lack of a better name, I called one future cloud but both are in fact a future cloud but just for 2 different periods.
Hope this helps??

Rohan, Have you tried encorporating momentum indicator? if waiting for future cross in your direction and if the momentum does not decease(for bullish)/ increase(for bearish) depending upon your direction you can decide not to jump into the trade. I found this useful especially with kumo breakout.