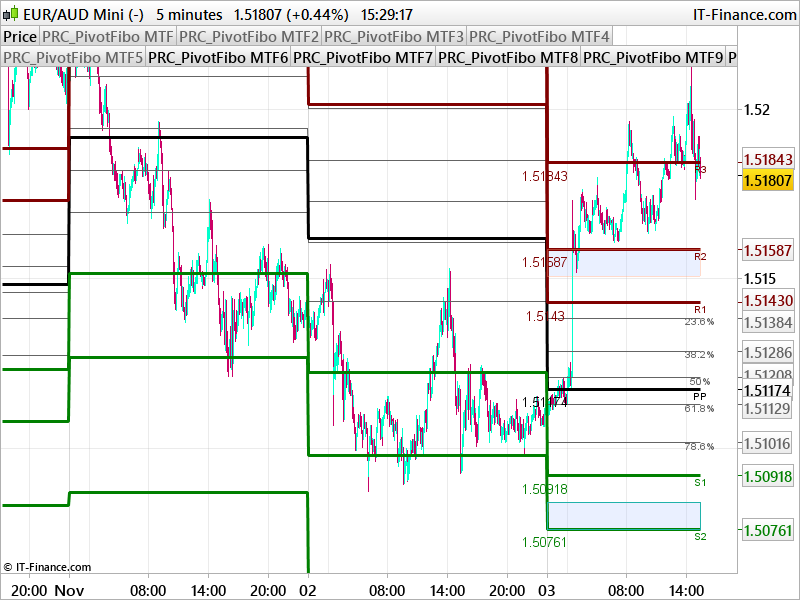
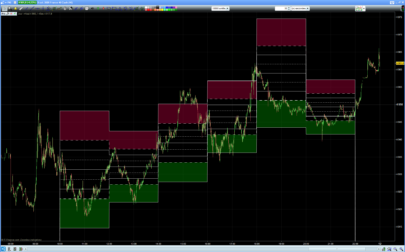
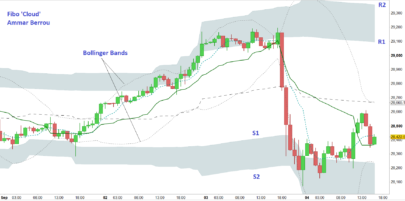
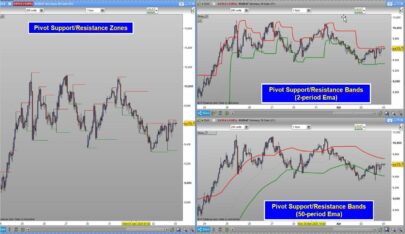
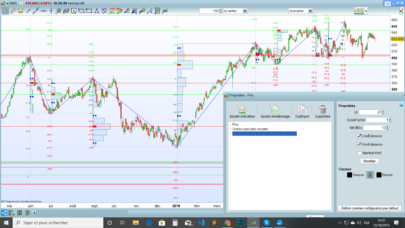
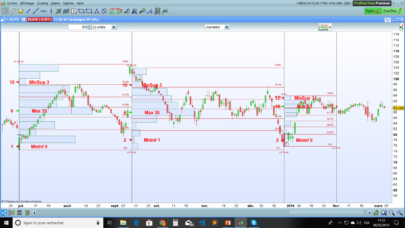
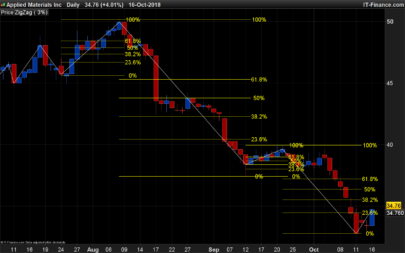
This is a whole new pivot points indicator with multiple timeframe capabilities:
4 different timeframes possible, make selection with “PivotTF” setting:
0 = Daily pivot points
1 = Weekly pivot points
2 = Monthly pivot points
3 = 4 hours pivots points
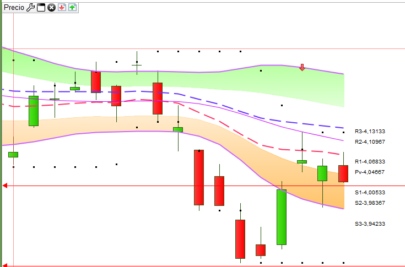
This pivots points indicator display also Fibonacci retracement numbers from previous period.
In settings, you also have the possibility to plot or not some informations:
_ middle pivot points (lines)
_ pivots and Fibonacci pivot points labels
_ pivots prices
_ “zones”(plotted with rectangles) between S1 and S2, and between R1 and R2
|
1 2 3 4 5 6 7 8 9 10 11 12 13 14 15 16 17 18 19 20 21 22 23 24 25 26 27 28 29 30 31 32 33 34 35 36 37 38 39 40 41 42 43 44 45 46 47 48 49 50 51 52 53 54 55 56 57 58 59 60 61 62 63 64 65 66 67 68 69 70 71 72 73 74 75 76 77 78 79 80 81 82 83 84 85 86 87 88 89 90 91 92 93 94 95 96 97 98 99 100 101 102 103 104 105 106 107 108 109 110 111 112 113 114 115 116 117 118 |
//PRC_PivotFibo MTF | indicator //03.11.2017 //Nicolas @ www.prorealcode.com //Sharing ProRealTime knowledge defparam drawonlastbaronly=true // --- settings //PlotPivots=1 //PlotPivotsLabels=1 //PlotPivotsPrices=1 //PlotMiddle=0 //PlotFibots=1 //PlotFibotsLabel=1 //PlotZones=1 //PivotTF = 3 //0=daily , 1=weekly , 2=monthly, 3=4 hours // --- end of settings if intradaybarindex=0 then if PivotTF=0 then firstbar=barindex cclose=close[1] hhigh=hh llow=ll endif hh=0 ll=close*10 endif if PivotTF=0 then hh=max(hh,high) ll=min(ll,low) elsif PivotTF=1 then if DayOfWeek<DayOfWeek[1] then hhigh = Highest[BarIndex - lastWeekBarIndex](High)[1] llow = Lowest[BarIndex - lastWeekBarIndex](Low)[1] cclose=close[1] lastWeekBarIndex = BarIndex firstbar=barindex Endif elsif PivotTF=2 then If Month<>Month[1] then hhigh = Highest[BarIndex - lastMonthBarIndex](High)[1] llow = Lowest[BarIndex - lastMonthBarIndex](Low)[1] cclose=close[1] lastMonthBarIndex = BarIndex firstbar=barindex endif elsif PivotTF=3 then //H4 timeframe if minute=0 and (hour=0 or hour=4 or hour=8 or hour=12 or hour=16 or hour=20) then hhigh = Highest[BarIndex - last4HourBarIndex](High)[1] llow = Lowest[BarIndex - last4HourBarIndex](Low)[1] cclose=close[0] last4HourBarIndex = BarIndex[0] firstbar=barindex[0] endif endif if(PlotPivots) then PP = (hhigh+llow+cclose)/3.0 R1 = PP+0.382*(hhigh-llow) rR2 = PP+0.618*(hhigh-llow) R3 = PP+1.000*(hhigh-llow) S1 = PP-0.382*(hhigh-llow) S2 = PP-0.618*(hhigh-llow) S3 = PP-1.000*(hhigh-llow) if(PlotMiddle) then M0=0.5*(S2+S3) M1=0.5*(S1+S2) M2=0.5*(PP+S1) M3=0.5*(PP+R1) M4=0.5*(R1+rR2) M5=0.5*(rR2+R3) endif if(PlotPivotsLabels) then drawtext("PP",barindex,PP-2*pointsize,Dialog,Standard,10)coloured(255,255,255) drawtext("R1",barindex,R1-2*pointsize,Dialog,Standard,10)coloured(128,0,0) drawtext("R2",barindex,RR2-2*pointsize,Dialog,Standard,10)coloured(128,0,0) drawtext("R3",barindex,R3-2*pointsize,Dialog,Standard,10)coloured(128,0,0) drawtext("S1",barindex,S1-2*pointsize,Dialog,Standard,10)coloured(0,128,0) drawtext("S2",barindex,S2-2*pointsize,Dialog,Standard,10)coloured(0,128,0) drawtext("S3",barindex,S3-2*pointsize,Dialog,Standard,10)coloured(0,128,0) endif if(PlotPivotsPrices) then drawtext("#PP#",firstbar,PP-4*pointsize,Dialog,Standard,13)coloured(255,255,255) drawtext("#R1#",firstbar,R1-4*pointsize,Dialog,Standard,13)coloured(128,0,0) drawtext("#rR2#",firstbar,RR2-4*pointsize,Dialog,Standard,13)coloured(128,0,0) drawtext("#R3#",firstbar,R3-4*pointsize,Dialog,Standard,13)coloured(128,0,0) drawtext("#S1#",firstbar,S1-4*pointsize,Dialog,Standard,13)coloured(0,128,0) drawtext("#S2#",firstbar,S2-4*pointsize,Dialog,Standard,13)coloured(0,128,0) drawtext("#S3#",firstbar,S3-4*pointsize,Dialog,Standard,13)coloured(0,128,0) endif if(PlotZones) then drawrectangle(firstbar,rr2,barindex,(rr2+r1)/2) coloured(255,160,122,100) drawrectangle(firstbar,s2,barindex,(s1+s2)/2) coloured(32,178,170) endif endif if(PlotFibots) then f236 = (llow+(((hhigh-llow)/100)*(100-23.6))) f382 = (llow+(((hhigh-llow)/100)*(100-38.2))) f50 = (llow+(((hhigh-llow)/100)*(100-50))) f618 = (llow+(((hhigh-llow)/100)*(38.2))) f786 = (llow+(((hhigh-llow)/100)*(21.4))) if(PlotFibotsLabel) then drawtext("23.6%",barindex,f236-1*pointsize,Dialog,Standard,10)coloured(100,100,100) drawtext("38.2%",barindex,f382-1*pointsize,Dialog,Standard,10)coloured(100,100,100) drawtext("50%",barindex,f50-1*pointsize,Dialog,Standard,10)coloured(100,100,100) drawtext("61.8%",barindex,f618-1*pointsize,Dialog,Standard,10)coloured(100,100,100) drawtext("78.6%",barindex,f786-1*pointsize,Dialog,Standard,10)coloured(100,100,100) endif endif return f236 coloured(100,100,100), f382 coloured(100,100,100), f50 coloured(100,100,100), f618 coloured(100,100,100), f786 coloured(100,100,100), M0,M1,M2,M3,M4,M5, PP coloured(255,255,255) style(line,3) as "PP", R1 coloured(128,0,0) style(line,3) as "R1", rR2 coloured(128,0,0) style(line,3) as "R2", R3 coloured(128,0,0) style(line,3) as "R3", S1 coloured(0,128,0) style(line,3) as "S1",S2 coloured(0,128,0) style(line,3) as "S2", S3 coloured(0,128,0) style(line,3) as "S3" |
Share this
No information on this site is investment advice or a solicitation to buy or sell any financial instrument. Past performance is not indicative of future results. Trading may expose you to risk of loss greater than your deposits and is only suitable for experienced investors who have sufficient financial means to bear such risk.
ProRealTime ITF files and other attachments :
Find other exclusive trading pro-tools on ![]()
PRC is also on YouTube, subscribe to our channel for exclusive content and tutorials


Toujours aussi prolifique notre ami Nicolas 🙂 Je vais certainement le “détourner” pour utiliser le tracé des niveaux Fibonacci afin d’avoir les niveaux d’intervention en continu comme par exemple le
“max/min”
d’un actif…
Merci pour tout ce travail, cordialement
Un grand merci Nicolas pour ton travail.
MERCI
Each time you switch the time period or First loading, the indicator shows a line that is crowded to one line. You need to pull it manually. How do you improve it?
Make vertical scaling to use price only in price settings.
Bonjour,
Pourquoi le “//PRC_PivotFibo MTF | indicator” ne s’affiche t’il pas sur les graphiques en Ticks???
Puisque l’indicateur se référe à des données qui peuvent être très loin dans le passé (changement d’un mois à un autre par exemple), assurez vous d’avoir assez d’historique affiché !!!
Je ne peux aller plus loin que le 30.10.2017 sur un graphique en Ticks. Et cela ne fonctionne pas! Quoiqu’il en soit merci pour ce travail c’est un outil très utile…
Merci pour ce travail…
Bonjour Nicolas, tu as fait qc avec les estensioni de Fibonacci? daily et weeckly?
2) question, est’il possible de donner une petite tollerance aux niveaux fibo en partant de volumes?
Bonjour Nicolas, ils sont super tes programmes. Une question: sais-tu comment faire des lignes horizontaux, comme ici les pivots, sans qu’il y a des traits/lignes diagonales/verticales entre les periodes? PRT le fasse avec ses pivots (et PRT ajoute un label à la fin de chaque segment) mais je n’arrive pas a le réproduire dans mes propres programmes. Dans tout cas, merci pour tes contributions et bonne fêtes de fin d’année.
Il faut tracer des segments d’un point à l’autre.
D’accord, merci beaucoup.
bonjour nicolas,
comment on peut faire pour que les points pivots apparaissent en 15min , c.a.d calculés en pivot fibo de 15min.
Il faudrait recoder un tout autre indicateur.
c’est pas si simple, puisque j’utilise des ut 1min pour scalper, donc avec des PP fibo 15 min , cela aurait été plus simple.
moi qui croyait qu’il fallait juste rajouter 2 ou 3 lignes de code.
merci nicolas pour ton travail
Merci de faire une demande spécifique sur le forum et j’essaierai d’y remédier.
voila nicolas c’est fait
https://www.prorealcode.com/topic/demande-de-programmation-point-fibo-sur-timeframe-de-15-min-et-5-min/
Merci, je m’en occupe dès que possible.
Hi Nicolas, I love this indicator except one thing, the vertical lines linking the horizontal pivot lines are really annoying to me, can you please show me or link how to change this indicator so it draws just horizontal lines for the pivots? I am guessing it needs to use code like this (https://www.prorealcode.com/documentation/drawline/) but plot the lines for each period (weekly) and I don’t know how to do that bit. Any help is much appreciated!
Please open a new topic in the forum for this specific coding question, and respect the posting rules.
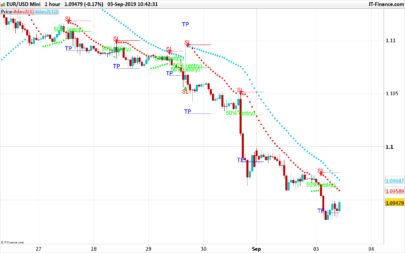
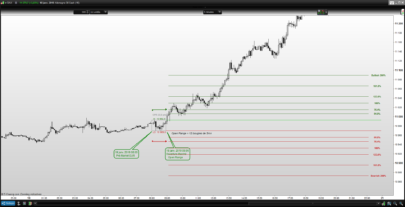
Fibonacci pivots represent the price evolution much better than classical pivots.
It is more efficient to work with these levels, thank you Nicolas.
Hi Nicholas, thanks for the indicator, is it possible to modify it to include the previous days range Fib extensions i.e. previous day’s range x 1.618, just as you have down the fib retracements of the precious days range? Also, is it possible to define the start and end time of the pivot calculation?. Many thanks in advance
further to my comment this thread : https://www.prorealcode.com/prorealtime-indicators/intraday-flexible-camarilla-pivot-points/ has the ability to define timeframe and start and end times for the pivot calculation but only for Camarilla. If that could be included in Nicholas’s above pivot indicator it would further enhance it. is it possible to modify it? apologies but i am new here so don’t know if requests for modifications accepted. Ifnot then apologies and thanks for your efforts.
Please open a new forum topic, and respect the posting rules. Add a precise description of what you need.
ok will do, apologies, as I said I am new here. many thanks
Version v2 including requested additions: https://www.prorealcode.com/prorealtime-indicators/fibonacci-pivots-points-v2-inc-custom-time-settings-for-daily/